Streptococcus phage Javan425
Taxonomy: Viruses; Duplodnaviria; Heunggongvirae; Uroviricota; Caudoviricetes; Caudovirales; Siphoviridae; unclassified Siphoviridae
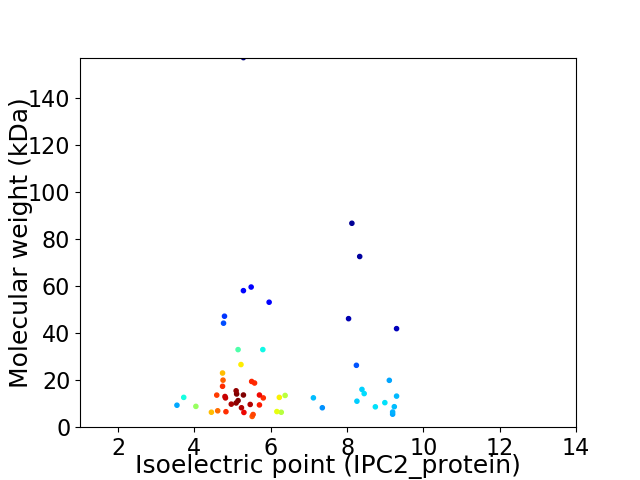
Average proteome isoelectric point is 6.14
Get precalculated fractions of proteins

Virtual 2D-PAGE plot for 58 proteins (isoelectric point calculated using IPC2_protein)
Get csv file with sequences according to given criteria:
* You can choose from 21 different methods for calculating isoelectric point
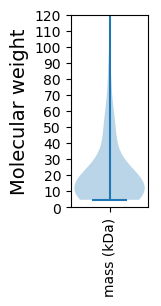
Summary statistics related to proteome-wise predictions


Protein with the lowest isoelectric point:
>tr|A0A4D6ABZ1|A0A4D6ABZ1_9CAUD Uncharacterized protein OS=Streptococcus phage Javan425 OX=2548161 GN=Javan425_0049 PE=4 SV=1
MM1 pKa = 7.37WVANDD6 pKa = 3.92YY7 pKa = 11.14EE8 pKa = 4.41DD9 pKa = 5.12LSEE12 pKa = 5.94LFMALDD18 pKa = 3.99TDD20 pKa = 3.45NSMFSDD26 pKa = 4.09PMQSTGLFDD35 pKa = 4.74KK36 pKa = 10.99NALEE40 pKa = 4.09IFEE43 pKa = 4.66GDD45 pKa = 3.52VVNAFDD51 pKa = 4.81YY52 pKa = 11.25DD53 pKa = 3.94SDD55 pKa = 3.91DD56 pKa = 3.47GKK58 pKa = 10.77IYY60 pKa = 9.33KK61 pKa = 8.03TTDD64 pKa = 2.88LTGVITYY71 pKa = 9.1HH72 pKa = 6.82KK73 pKa = 10.57NAFCIQSGKK82 pKa = 10.1ILIDD86 pKa = 3.46LWVHH90 pKa = 6.15AEE92 pKa = 4.3GIEE95 pKa = 4.24IIGNIYY101 pKa = 9.99QNSDD105 pKa = 3.18LLEE108 pKa = 4.46SVEE111 pKa = 4.28EE112 pKa = 4.18
MM1 pKa = 7.37WVANDD6 pKa = 3.92YY7 pKa = 11.14EE8 pKa = 4.41DD9 pKa = 5.12LSEE12 pKa = 5.94LFMALDD18 pKa = 3.99TDD20 pKa = 3.45NSMFSDD26 pKa = 4.09PMQSTGLFDD35 pKa = 4.74KK36 pKa = 10.99NALEE40 pKa = 4.09IFEE43 pKa = 4.66GDD45 pKa = 3.52VVNAFDD51 pKa = 4.81YY52 pKa = 11.25DD53 pKa = 3.94SDD55 pKa = 3.91DD56 pKa = 3.47GKK58 pKa = 10.77IYY60 pKa = 9.33KK61 pKa = 8.03TTDD64 pKa = 2.88LTGVITYY71 pKa = 9.1HH72 pKa = 6.82KK73 pKa = 10.57NAFCIQSGKK82 pKa = 10.1ILIDD86 pKa = 3.46LWVHH90 pKa = 6.15AEE92 pKa = 4.3GIEE95 pKa = 4.24IIGNIYY101 pKa = 9.99QNSDD105 pKa = 3.18LLEE108 pKa = 4.46SVEE111 pKa = 4.28EE112 pKa = 4.18
Molecular weight: 12.67 kDa
Isoelectric point according different methods:
Protein with the highest isoelectric point:
>tr|A0A4D6AF95|A0A4D6AF95_9CAUD Uncharacterized protein OS=Streptococcus phage Javan425 OX=2548161 GN=Javan425_0037 PE=4 SV=1
MM1 pKa = 7.45TPPTSNLRR9 pKa = 11.84ADD11 pKa = 3.33KK12 pKa = 10.9KK13 pKa = 8.9GTHH16 pKa = 5.72RR17 pKa = 11.84VAFDD21 pKa = 3.43RR22 pKa = 11.84NKK24 pKa = 10.59RR25 pKa = 11.84KK26 pKa = 9.48LLKK29 pKa = 9.25TVNVCGICGKK39 pKa = 9.69PVDD42 pKa = 4.28KK43 pKa = 10.64SLKK46 pKa = 8.99YY47 pKa = 8.81PHH49 pKa = 7.29PLSPAIDD56 pKa = 4.39HH57 pKa = 6.59IVPIAKK63 pKa = 9.92GGHH66 pKa = 6.37PSSMDD71 pKa = 3.44NLQLTHH77 pKa = 6.02WQCNRR82 pKa = 11.84QKK84 pKa = 10.95SDD86 pKa = 3.02KK87 pKa = 10.48LYY89 pKa = 11.19SDD91 pKa = 5.34VKK93 pKa = 10.82QQDD96 pKa = 3.14QKK98 pKa = 10.24TVGNRR103 pKa = 11.84NLPQSRR109 pKa = 11.84DD110 pKa = 2.99WSSYY114 pKa = 9.41ASKK117 pKa = 11.11
MM1 pKa = 7.45TPPTSNLRR9 pKa = 11.84ADD11 pKa = 3.33KK12 pKa = 10.9KK13 pKa = 8.9GTHH16 pKa = 5.72RR17 pKa = 11.84VAFDD21 pKa = 3.43RR22 pKa = 11.84NKK24 pKa = 10.59RR25 pKa = 11.84KK26 pKa = 9.48LLKK29 pKa = 9.25TVNVCGICGKK39 pKa = 9.69PVDD42 pKa = 4.28KK43 pKa = 10.64SLKK46 pKa = 8.99YY47 pKa = 8.81PHH49 pKa = 7.29PLSPAIDD56 pKa = 4.39HH57 pKa = 6.59IVPIAKK63 pKa = 9.92GGHH66 pKa = 6.37PSSMDD71 pKa = 3.44NLQLTHH77 pKa = 6.02WQCNRR82 pKa = 11.84QKK84 pKa = 10.95SDD86 pKa = 3.02KK87 pKa = 10.48LYY89 pKa = 11.19SDD91 pKa = 5.34VKK93 pKa = 10.82QQDD96 pKa = 3.14QKK98 pKa = 10.24TVGNRR103 pKa = 11.84NLPQSRR109 pKa = 11.84DD110 pKa = 2.99WSSYY114 pKa = 9.41ASKK117 pKa = 11.11
Molecular weight: 13.21 kDa
Isoelectric point according different methods:
Peptides (in silico digests for buttom-up proteomics)
Below you can find in silico digests of the whole proteome with Trypsin, Chymotrypsin, Trypsin+LysC, LysN, ArgC proteases suitable for different mass spec machines.| Try ESI |
 |
|---|
| ChTry ESI |
 |
|---|
| ArgC ESI |
 |
|---|
| LysN ESI |
 |
|---|
| TryLysC ESI |
 |
|---|
| Try MALDI |
 |
|---|
| ChTry MALDI |
 |
|---|
| ArgC MALDI |
 |
|---|
| LysN MALDI |
 |
|---|
| TryLysC MALDI |
 |
|---|
| Try LTQ |
 |
|---|
| ChTry LTQ |
 |
|---|
| ArgC LTQ |
 |
|---|
| LysN LTQ |
 |
|---|
| TryLysC LTQ |
 |
|---|
| Try MSlow |
 |
|---|
| ChTry MSlow |
 |
|---|
| ArgC MSlow |
 |
|---|
| LysN MSlow |
 |
|---|
| TryLysC MSlow |
 |
|---|
| Try MShigh |
 |
|---|
| ChTry MShigh |
 |
|---|
| ArgC MShigh |
 |
|---|
| LysN MShigh |
 |
|---|
| TryLysC MShigh |
 |
|---|
General Statistics
Number of major isoforms |
Number of additional isoforms |
Number of all proteins |
Number of amino acids |
Min. Seq. Length |
Max. Seq. Length |
Avg. Seq. Length |
Avg. Mol. Weight |
|---|---|---|---|---|---|---|---|
0 |
11437 |
40 |
1418 |
197.2 |
22.29 |
Amino acid frequency
Ala |
Cys |
Asp |
Glu |
Phe |
Gly |
His |
Ile |
Lys |
Leu |
|---|---|---|---|---|---|---|---|---|---|
6.357 ± 0.448 | 0.63 ± 0.114 |
6.269 ± 0.291 | 7.1 ± 0.457 |
4.249 ± 0.244 | 6.628 ± 0.382 |
1.381 ± 0.125 | 7.537 ± 0.316 |
8.595 ± 0.423 | 7.913 ± 0.294 |
Met |
Asn |
Gln |
Pro |
Arg |
Ser |
Thr |
Val |
Trp |
Tyr |
|---|---|---|---|---|---|---|---|---|---|
2.536 ± 0.209 | 5.806 ± 0.21 |
2.754 ± 0.162 | 3.672 ± 0.188 |
3.515 ± 0.238 | 6.435 ± 0.394 |
6.829 ± 0.445 | 6.173 ± 0.203 |
1.399 ± 0.121 | 4.223 ± 0.274 |
Most of the basic statistics you can see at this page can be downloaded from this CSV file
Proteome-pI is available under Creative Commons Attribution-NoDerivs license, for more details see here
| Reference: Kozlowski LP. Proteome-pI 2.0: Proteome Isoelectric Point Database Update. Nucleic Acids Res. 2021, doi: 10.1093/nar/gkab944 | Contact: Lukasz P. Kozlowski |
