Caulifigura coniformis
Taxonomy: cellular organisms; Bacteria; PVC group; Planctomycetes; Planctomycetia; Planctomycetales; Planctomycetaceae; Caulifigura
Average proteome isoelectric point is 6.59
Get precalculated fractions of proteins

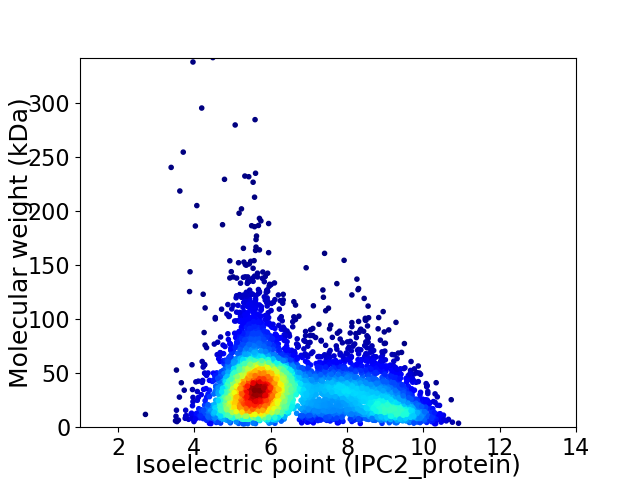
Virtual 2D-PAGE plot for 5497 proteins (isoelectric point calculated using IPC2_protein)
Get csv file with sequences according to given criteria:
* You can choose from 21 different methods for calculating isoelectric point
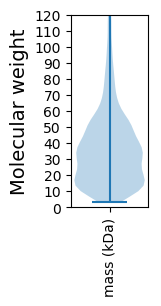
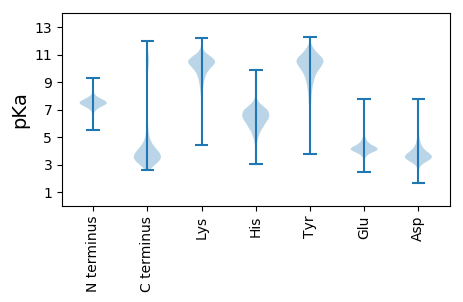
Summary statistics related to proteome-wise predictions


Protein with the lowest isoelectric point:
>tr|A0A517SIB0|A0A517SIB0_9PLAN N-acetylglucosamine-6-phosphate deacetylase OS=Caulifigura coniformis OX=2527983 GN=nagA_6 PE=3 SV=1
MM1 pKa = 7.47LFSRR5 pKa = 11.84YY6 pKa = 7.52ATCIRR11 pKa = 11.84CCALLIITAVGLPARR26 pKa = 11.84AEE28 pKa = 4.14IITFDD33 pKa = 4.76DD34 pKa = 4.42LPPGQGTQYY43 pKa = 10.95SGADD47 pKa = 3.43VVGSYY52 pKa = 11.17YY53 pKa = 11.06YY54 pKa = 10.97GDD56 pKa = 3.99SPDD59 pKa = 3.53GVIVEE64 pKa = 4.46GTYY67 pKa = 10.85GPVYY71 pKa = 10.4EE72 pKa = 4.61STFTSGGAGFINRR85 pKa = 11.84VDD87 pKa = 3.37QTYY90 pKa = 10.65GSWSGFSYY98 pKa = 11.33SNVSDD103 pKa = 2.97IVTPGFEE110 pKa = 4.19NQYY113 pKa = 11.16AAYY116 pKa = 8.24TLSDD120 pKa = 4.27PGSGMGPGVDD130 pKa = 3.15NYY132 pKa = 11.17GIAFGYY138 pKa = 10.84DD139 pKa = 3.44DD140 pKa = 4.35IVPNLFDD147 pKa = 5.69PDD149 pKa = 4.23AFDD152 pKa = 3.96PTDD155 pKa = 3.37IADD158 pKa = 4.67LFRR161 pKa = 11.84LPTLSLPTGMAAVGMYY177 pKa = 7.67VTNTTYY183 pKa = 11.24AALSMLGGDD192 pKa = 3.83SFGKK196 pKa = 8.79TFGGASGDD204 pKa = 3.69DD205 pKa = 3.69PDD207 pKa = 4.03WFKK210 pKa = 10.91LTAYY214 pKa = 10.45GIGADD219 pKa = 3.85GLAMAEE225 pKa = 4.1SVEE228 pKa = 5.11FYY230 pKa = 10.76LADD233 pKa = 3.54YY234 pKa = 10.96RR235 pKa = 11.84FDD237 pKa = 5.56DD238 pKa = 3.72NSLDD242 pKa = 4.03YY243 pKa = 10.92IVDD246 pKa = 3.2DD247 pKa = 4.17WTWMDD252 pKa = 4.46LSALADD258 pKa = 3.62AKK260 pKa = 10.93SLHH263 pKa = 6.43FNLASSDD270 pKa = 3.55AGDD273 pKa = 3.62FGMNTPAYY281 pKa = 10.0FAMDD285 pKa = 4.45DD286 pKa = 3.97LQLEE290 pKa = 4.54AVPEE294 pKa = 4.16PTSLMFAAVTGLGVVLRR311 pKa = 11.84RR312 pKa = 11.84RR313 pKa = 11.84GLRR316 pKa = 11.84KK317 pKa = 9.73KK318 pKa = 10.51SAA320 pKa = 3.26
MM1 pKa = 7.47LFSRR5 pKa = 11.84YY6 pKa = 7.52ATCIRR11 pKa = 11.84CCALLIITAVGLPARR26 pKa = 11.84AEE28 pKa = 4.14IITFDD33 pKa = 4.76DD34 pKa = 4.42LPPGQGTQYY43 pKa = 10.95SGADD47 pKa = 3.43VVGSYY52 pKa = 11.17YY53 pKa = 11.06YY54 pKa = 10.97GDD56 pKa = 3.99SPDD59 pKa = 3.53GVIVEE64 pKa = 4.46GTYY67 pKa = 10.85GPVYY71 pKa = 10.4EE72 pKa = 4.61STFTSGGAGFINRR85 pKa = 11.84VDD87 pKa = 3.37QTYY90 pKa = 10.65GSWSGFSYY98 pKa = 11.33SNVSDD103 pKa = 2.97IVTPGFEE110 pKa = 4.19NQYY113 pKa = 11.16AAYY116 pKa = 8.24TLSDD120 pKa = 4.27PGSGMGPGVDD130 pKa = 3.15NYY132 pKa = 11.17GIAFGYY138 pKa = 10.84DD139 pKa = 3.44DD140 pKa = 4.35IVPNLFDD147 pKa = 5.69PDD149 pKa = 4.23AFDD152 pKa = 3.96PTDD155 pKa = 3.37IADD158 pKa = 4.67LFRR161 pKa = 11.84LPTLSLPTGMAAVGMYY177 pKa = 7.67VTNTTYY183 pKa = 11.24AALSMLGGDD192 pKa = 3.83SFGKK196 pKa = 8.79TFGGASGDD204 pKa = 3.69DD205 pKa = 3.69PDD207 pKa = 4.03WFKK210 pKa = 10.91LTAYY214 pKa = 10.45GIGADD219 pKa = 3.85GLAMAEE225 pKa = 4.1SVEE228 pKa = 5.11FYY230 pKa = 10.76LADD233 pKa = 3.54YY234 pKa = 10.96RR235 pKa = 11.84FDD237 pKa = 5.56DD238 pKa = 3.72NSLDD242 pKa = 4.03YY243 pKa = 10.92IVDD246 pKa = 3.2DD247 pKa = 4.17WTWMDD252 pKa = 4.46LSALADD258 pKa = 3.62AKK260 pKa = 10.93SLHH263 pKa = 6.43FNLASSDD270 pKa = 3.55AGDD273 pKa = 3.62FGMNTPAYY281 pKa = 10.0FAMDD285 pKa = 4.45DD286 pKa = 3.97LQLEE290 pKa = 4.54AVPEE294 pKa = 4.16PTSLMFAAVTGLGVVLRR311 pKa = 11.84RR312 pKa = 11.84RR313 pKa = 11.84GLRR316 pKa = 11.84KK317 pKa = 9.73KK318 pKa = 10.51SAA320 pKa = 3.26
Molecular weight: 34.2 kDa
Isoelectric point according different methods:
Protein with the highest isoelectric point:
>tr|A0A517SGF1|A0A517SGF1_9PLAN Uncharacterized protein OS=Caulifigura coniformis OX=2527983 GN=Pan44_32440 PE=4 SV=1
MM1 pKa = 7.64AKK3 pKa = 9.89NAKK6 pKa = 8.9KK7 pKa = 10.38LKK9 pKa = 9.73RR10 pKa = 11.84ANHH13 pKa = 5.73GKK15 pKa = 10.04RR16 pKa = 11.84PASHH20 pKa = 7.08KK21 pKa = 10.44ARR23 pKa = 11.84RR24 pKa = 11.84AKK26 pKa = 10.3RR27 pKa = 11.84AMIKK31 pKa = 8.79TT32 pKa = 3.78
MM1 pKa = 7.64AKK3 pKa = 9.89NAKK6 pKa = 8.9KK7 pKa = 10.38LKK9 pKa = 9.73RR10 pKa = 11.84ANHH13 pKa = 5.73GKK15 pKa = 10.04RR16 pKa = 11.84PASHH20 pKa = 7.08KK21 pKa = 10.44ARR23 pKa = 11.84RR24 pKa = 11.84AKK26 pKa = 10.3RR27 pKa = 11.84AMIKK31 pKa = 8.79TT32 pKa = 3.78
Molecular weight: 3.66 kDa
Isoelectric point according different methods:
Peptides (in silico digests for buttom-up proteomics)
Below you can find in silico digests of the whole proteome with Trypsin, Chymotrypsin, Trypsin+LysC, LysN, ArgC proteases suitable for different mass spec machines.| Try ESI |
 |
|---|
| ChTry ESI |
 |
|---|
| ArgC ESI |
 |
|---|
| LysN ESI |
 |
|---|
| TryLysC ESI |
 |
|---|
| Try MALDI |
 |
|---|
| ChTry MALDI |
 |
|---|
| ArgC MALDI |
 |
|---|
| LysN MALDI |
 |
|---|
| TryLysC MALDI |
 |
|---|
| Try LTQ |
 |
|---|
| ChTry LTQ |
 |
|---|
| ArgC LTQ |
 |
|---|
| LysN LTQ |
 |
|---|
| TryLysC LTQ |
 |
|---|
| Try MSlow |
 |
|---|
| ChTry MSlow |
 |
|---|
| ArgC MSlow |
 |
|---|
| LysN MSlow |
 |
|---|
| TryLysC MSlow |
 |
|---|
| Try MShigh |
 |
|---|
| ChTry MShigh |
 |
|---|
| ArgC MShigh |
 |
|---|
| LysN MShigh |
 |
|---|
| TryLysC MShigh |
 |
|---|
General Statistics
Number of major isoforms |
Number of additional isoforms |
Number of all proteins |
Number of amino acids |
Min. Seq. Length |
Max. Seq. Length |
Avg. Seq. Length |
Avg. Mol. Weight |
|---|---|---|---|---|---|---|---|
0 |
1946564 |
29 |
3238 |
354.1 |
38.78 |
Amino acid frequency
Ala |
Cys |
Asp |
Glu |
Phe |
Gly |
His |
Ile |
Lys |
Leu |
|---|---|---|---|---|---|---|---|---|---|
10.725 ± 0.039 | 1.106 ± 0.013 |
5.679 ± 0.026 | 6.015 ± 0.028 |
3.703 ± 0.02 | 8.087 ± 0.03 |
2.097 ± 0.015 | 4.593 ± 0.023 |
3.683 ± 0.029 | 9.876 ± 0.039 |
Met |
Asn |
Gln |
Pro |
Arg |
Ser |
Thr |
Val |
Trp |
Tyr |
|---|---|---|---|---|---|---|---|---|---|
2.124 ± 0.014 | 2.851 ± 0.027 |
5.733 ± 0.03 | 3.615 ± 0.024 |
7.267 ± 0.033 | 6.147 ± 0.022 |
5.559 ± 0.031 | 7.41 ± 0.028 |
1.564 ± 0.015 | 2.168 ± 0.017 |
Most of the basic statistics you can see at this page can be downloaded from this CSV file
Proteome-pI is available under Creative Commons Attribution-NoDerivs license, for more details see here
| Reference: Kozlowski LP. Proteome-pI 2.0: Proteome Isoelectric Point Database Update. Nucleic Acids Res. 2021, doi: 10.1093/nar/gkab944 | Contact: Lukasz P. Kozlowski |
