Rhodobacter sphaeroides (strain ATCC 17023 / DSM 158 / JCM 6121 / NBRC 12203 / NCIMB 8253 / ATH 2.4.1.) (Cereibacter sphaeroides)
Taxonomy: cellular organisms; Bacteria; Proteobacteria; Alphaproteobacteria; Rhodobacterales; Rhodobacteraceae; Cereibacter; Cereibacter sphaeroides
Average proteome isoelectric point is 6.48
Get precalculated fractions of proteins

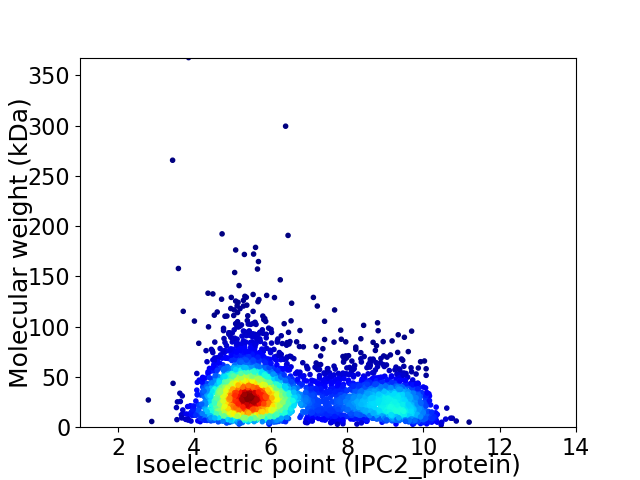
Virtual 2D-PAGE plot for 4285 proteins (isoelectric point calculated using IPC2_protein)
Get csv file with sequences according to given criteria:
* You can choose from 21 different methods for calculating isoelectric point
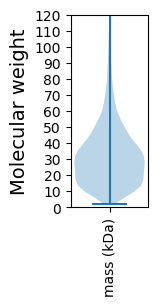
Summary statistics related to proteome-wise predictions


Protein with the lowest isoelectric point:
>tr|Q3IZQ1|Q3IZQ1_RHOS4 ABC dipeptide transporter ATPase subunit DppD OS=Rhodobacter sphaeroides (strain ATCC 17023 / DSM 158 / JCM 6121 / NBRC 12203 / NCIMB 8253 / ATH 2.4.1.) OX=272943 GN=DppD PE=4 SV=1
MM1 pKa = 7.15KK2 pKa = 10.32QILLATTALVMTAGVAAAEE21 pKa = 4.4ISFSGYY27 pKa = 11.08AEE29 pKa = 4.0MGVVGGGDD37 pKa = 3.67DD38 pKa = 3.46APARR42 pKa = 11.84AGHH45 pKa = 6.33AAGGQTEE52 pKa = 3.98FHH54 pKa = 6.87NDD56 pKa = 2.64FNLIVTMTSEE66 pKa = 4.4TDD68 pKa = 2.71TGLAFGASVEE78 pKa = 4.05ISKK81 pKa = 11.22DD82 pKa = 3.39EE83 pKa = 4.29GDD85 pKa = 3.91SNGNFAADD93 pKa = 3.42NEE95 pKa = 4.37AAFISGAFGTLTMGEE110 pKa = 4.1IDD112 pKa = 5.24GAMDD116 pKa = 3.25WAMTEE121 pKa = 4.11NVGNPGTIGDD131 pKa = 5.01DD132 pKa = 3.64EE133 pKa = 4.64TTHH136 pKa = 6.55AGYY139 pKa = 10.39FGAYY143 pKa = 10.13GDD145 pKa = 4.24GKK147 pKa = 10.92YY148 pKa = 10.71DD149 pKa = 3.59NQIARR154 pKa = 11.84YY155 pKa = 8.43EE156 pKa = 4.03YY157 pKa = 10.22SFGDD161 pKa = 3.37FGVAISAEE169 pKa = 4.13LDD171 pKa = 3.56DD172 pKa = 4.69TDD174 pKa = 4.43TNGDD178 pKa = 3.59GYY180 pKa = 11.44AIGAKK185 pKa = 10.2YY186 pKa = 10.37KK187 pKa = 10.92GDD189 pKa = 3.45FGGFGMGFGLAYY201 pKa = 8.95QTFEE205 pKa = 3.93TDD207 pKa = 3.41VLVGLGSQEE216 pKa = 3.74AALVGGDD223 pKa = 3.83VEE225 pKa = 5.16LLGASVNADD234 pKa = 3.4FNNGFVAGLAYY245 pKa = 9.79TDD247 pKa = 3.96ISSDD251 pKa = 3.54AQDD254 pKa = 3.91GNHH257 pKa = 6.81LGLSAGFTTGAFQIGANYY275 pKa = 10.32GVFDD279 pKa = 4.63MDD281 pKa = 3.58VQDD284 pKa = 4.89KK285 pKa = 10.34VKK287 pKa = 10.3GWGVAAAYY295 pKa = 10.2DD296 pKa = 3.72LGGGLKK302 pKa = 10.43LHH304 pKa = 6.84GGYY307 pKa = 10.43GDD309 pKa = 3.97SDD311 pKa = 3.55IDD313 pKa = 4.0GVDD316 pKa = 3.65GDD318 pKa = 4.41FEE320 pKa = 4.82TYY322 pKa = 10.47SVGLSMSFF330 pKa = 3.27
MM1 pKa = 7.15KK2 pKa = 10.32QILLATTALVMTAGVAAAEE21 pKa = 4.4ISFSGYY27 pKa = 11.08AEE29 pKa = 4.0MGVVGGGDD37 pKa = 3.67DD38 pKa = 3.46APARR42 pKa = 11.84AGHH45 pKa = 6.33AAGGQTEE52 pKa = 3.98FHH54 pKa = 6.87NDD56 pKa = 2.64FNLIVTMTSEE66 pKa = 4.4TDD68 pKa = 2.71TGLAFGASVEE78 pKa = 4.05ISKK81 pKa = 11.22DD82 pKa = 3.39EE83 pKa = 4.29GDD85 pKa = 3.91SNGNFAADD93 pKa = 3.42NEE95 pKa = 4.37AAFISGAFGTLTMGEE110 pKa = 4.1IDD112 pKa = 5.24GAMDD116 pKa = 3.25WAMTEE121 pKa = 4.11NVGNPGTIGDD131 pKa = 5.01DD132 pKa = 3.64EE133 pKa = 4.64TTHH136 pKa = 6.55AGYY139 pKa = 10.39FGAYY143 pKa = 10.13GDD145 pKa = 4.24GKK147 pKa = 10.92YY148 pKa = 10.71DD149 pKa = 3.59NQIARR154 pKa = 11.84YY155 pKa = 8.43EE156 pKa = 4.03YY157 pKa = 10.22SFGDD161 pKa = 3.37FGVAISAEE169 pKa = 4.13LDD171 pKa = 3.56DD172 pKa = 4.69TDD174 pKa = 4.43TNGDD178 pKa = 3.59GYY180 pKa = 11.44AIGAKK185 pKa = 10.2YY186 pKa = 10.37KK187 pKa = 10.92GDD189 pKa = 3.45FGGFGMGFGLAYY201 pKa = 8.95QTFEE205 pKa = 3.93TDD207 pKa = 3.41VLVGLGSQEE216 pKa = 3.74AALVGGDD223 pKa = 3.83VEE225 pKa = 5.16LLGASVNADD234 pKa = 3.4FNNGFVAGLAYY245 pKa = 9.79TDD247 pKa = 3.96ISSDD251 pKa = 3.54AQDD254 pKa = 3.91GNHH257 pKa = 6.81LGLSAGFTTGAFQIGANYY275 pKa = 10.32GVFDD279 pKa = 4.63MDD281 pKa = 3.58VQDD284 pKa = 4.89KK285 pKa = 10.34VKK287 pKa = 10.3GWGVAAAYY295 pKa = 10.2DD296 pKa = 3.72LGGGLKK302 pKa = 10.43LHH304 pKa = 6.84GGYY307 pKa = 10.43GDD309 pKa = 3.97SDD311 pKa = 3.55IDD313 pKa = 4.0GVDD316 pKa = 3.65GDD318 pKa = 4.41FEE320 pKa = 4.82TYY322 pKa = 10.47SVGLSMSFF330 pKa = 3.27
Molecular weight: 33.76 kDa
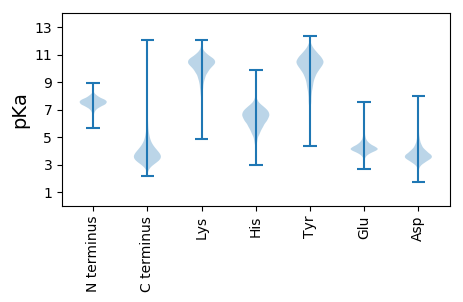
Isoelectric point according different methods:
Protein with the highest isoelectric point:
>tr|Q3IYZ4|Q3IYZ4_RHOS4 Histidine kinase OS=Rhodobacter sphaeroides (strain ATCC 17023 / DSM 158 / JCM 6121 / NBRC 12203 / NCIMB 8253 / ATH 2.4.1.) OX=272943 GN=RSP_1056 PE=4 SV=1
MM1 pKa = 7.45KK2 pKa = 9.61RR3 pKa = 11.84TFQPSNLVRR12 pKa = 11.84ARR14 pKa = 11.84RR15 pKa = 11.84HH16 pKa = 4.37GFRR19 pKa = 11.84ARR21 pKa = 11.84MATKK25 pKa = 10.39GGRR28 pKa = 11.84LVLNARR34 pKa = 11.84RR35 pKa = 11.84AKK37 pKa = 10.06GRR39 pKa = 11.84KK40 pKa = 8.83KK41 pKa = 10.63LSAA44 pKa = 3.95
MM1 pKa = 7.45KK2 pKa = 9.61RR3 pKa = 11.84TFQPSNLVRR12 pKa = 11.84ARR14 pKa = 11.84RR15 pKa = 11.84HH16 pKa = 4.37GFRR19 pKa = 11.84ARR21 pKa = 11.84MATKK25 pKa = 10.39GGRR28 pKa = 11.84LVLNARR34 pKa = 11.84RR35 pKa = 11.84AKK37 pKa = 10.06GRR39 pKa = 11.84KK40 pKa = 8.83KK41 pKa = 10.63LSAA44 pKa = 3.95
Molecular weight: 5.05 kDa
Isoelectric point according different methods:
Peptides (in silico digests for buttom-up proteomics)
Below you can find in silico digests of the whole proteome with Trypsin, Chymotrypsin, Trypsin+LysC, LysN, ArgC proteases suitable for different mass spec machines.| Try ESI |
 |
|---|
| ChTry ESI |
 |
|---|
| ArgC ESI |
 |
|---|
| LysN ESI |
 |
|---|
| TryLysC ESI |
 |
|---|
| Try MALDI |
 |
|---|
| ChTry MALDI |
 |
|---|
| ArgC MALDI |
 |
|---|
| LysN MALDI |
 |
|---|
| TryLysC MALDI |
 |
|---|
| Try LTQ |
 |
|---|
| ChTry LTQ |
 |
|---|
| ArgC LTQ |
 |
|---|
| LysN LTQ |
 |
|---|
| TryLysC LTQ |
 |
|---|
| Try MSlow |
 |
|---|
| ChTry MSlow |
 |
|---|
| ArgC MSlow |
 |
|---|
| LysN MSlow |
 |
|---|
| TryLysC MSlow |
 |
|---|
| Try MShigh |
 |
|---|
| ChTry MShigh |
 |
|---|
| ArgC MShigh |
 |
|---|
| LysN MShigh |
 |
|---|
| TryLysC MShigh |
 |
|---|
General Statistics
Number of major isoforms |
Number of additional isoforms |
Number of all proteins |
Number of amino acids |
Min. Seq. Length |
Max. Seq. Length |
Avg. Seq. Length |
Avg. Mol. Weight |
|---|---|---|---|---|---|---|---|
0 |
1331697 |
20 |
3634 |
310.8 |
33.55 |
Amino acid frequency
Ala |
Cys |
Asp |
Glu |
Phe |
Gly |
His |
Ile |
Lys |
Leu |
|---|---|---|---|---|---|---|---|---|---|
13.681 ± 0.068 | 0.87 ± 0.012 |
5.357 ± 0.038 | 6.265 ± 0.033 |
3.483 ± 0.024 | 8.97 ± 0.036 |
1.956 ± 0.017 | 4.527 ± 0.026 |
2.43 ± 0.031 | 10.871 ± 0.047 |
Met |
Asn |
Gln |
Pro |
Arg |
Ser |
Thr |
Val |
Trp |
Tyr |
|---|---|---|---|---|---|---|---|---|---|
2.554 ± 0.018 | 2.037 ± 0.021 |
5.595 ± 0.037 | 2.874 ± 0.022 |
7.935 ± 0.041 | 4.886 ± 0.029 |
5.151 ± 0.034 | 7.225 ± 0.029 |
1.395 ± 0.017 | 1.936 ± 0.02 |
Most of the basic statistics you can see at this page can be downloaded from this CSV file
Proteome-pI is available under Creative Commons Attribution-NoDerivs license, for more details see here
| Reference: Kozlowski LP. Proteome-pI 2.0: Proteome Isoelectric Point Database Update. Nucleic Acids Res. 2021, doi: 10.1093/nar/gkab944 | Contact: Lukasz P. Kozlowski |
