Dubosiella newyorkensis
Taxonomy: cellular organisms; Bacteria; Terrabacteria group; Firmicutes; Erysipelotrichia; Erysipelotrichales; Erysipelotrichaceae; Dubosiella
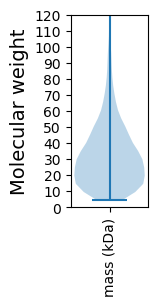
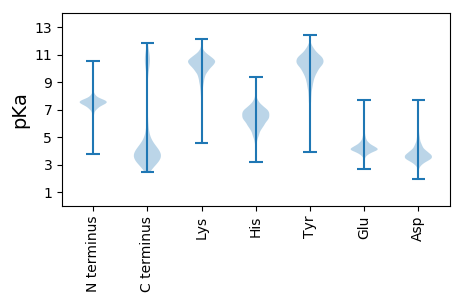
Average proteome isoelectric point is 6.22
Get precalculated fractions of proteins

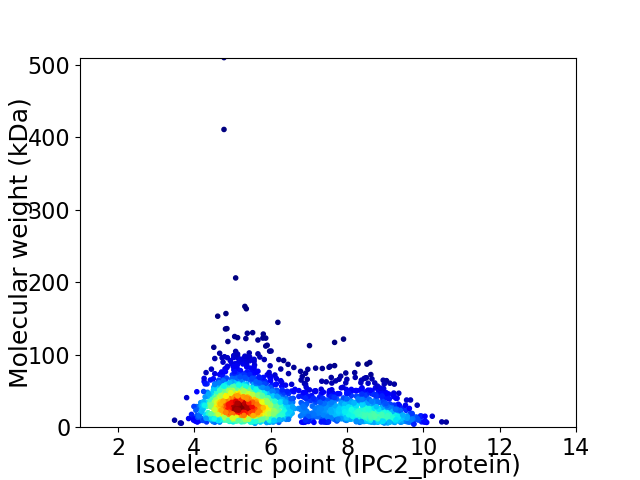
Virtual 2D-PAGE plot for 2225 proteins (isoelectric point calculated using IPC2_protein)
Get csv file with sequences according to given criteria:
* You can choose from 21 different methods for calculating isoelectric point
Summary statistics related to proteome-wise predictions


Protein with the lowest isoelectric point:
>tr|A0A1U7NK53|A0A1U7NK53_9FIRM YhcH/YjgK/YiaL family protein OS=Dubosiella newyorkensis OX=1862672 GN=BO225_10845 PE=4 SV=1
MM1 pKa = 7.61SLLQIQGVQDD11 pKa = 3.47YY12 pKa = 10.35EE13 pKa = 5.03RR14 pKa = 11.84IVHH17 pKa = 6.7EE18 pKa = 4.28YY19 pKa = 9.07PNVVVEE25 pKa = 7.7FFATWCPHH33 pKa = 5.28CQAMQPDD40 pKa = 4.34VEE42 pKa = 4.36QAAEE46 pKa = 3.9QFEE49 pKa = 4.55QVVIAQADD57 pKa = 3.44VDD59 pKa = 4.29QNEE62 pKa = 4.39EE63 pKa = 3.85LCDD66 pKa = 3.54AFNVQGTPTFIFVKK80 pKa = 10.27DD81 pKa = 3.91GKK83 pKa = 9.8PVLDD87 pKa = 3.51TVGQISYY94 pKa = 10.49EE95 pKa = 4.02DD96 pKa = 3.71LVDD99 pKa = 5.34FIQKK103 pKa = 10.47GEE105 pKa = 4.2SKK107 pKa = 10.93
MM1 pKa = 7.61SLLQIQGVQDD11 pKa = 3.47YY12 pKa = 10.35EE13 pKa = 5.03RR14 pKa = 11.84IVHH17 pKa = 6.7EE18 pKa = 4.28YY19 pKa = 9.07PNVVVEE25 pKa = 7.7FFATWCPHH33 pKa = 5.28CQAMQPDD40 pKa = 4.34VEE42 pKa = 4.36QAAEE46 pKa = 3.9QFEE49 pKa = 4.55QVVIAQADD57 pKa = 3.44VDD59 pKa = 4.29QNEE62 pKa = 4.39EE63 pKa = 3.85LCDD66 pKa = 3.54AFNVQGTPTFIFVKK80 pKa = 10.27DD81 pKa = 3.91GKK83 pKa = 9.8PVLDD87 pKa = 3.51TVGQISYY94 pKa = 10.49EE95 pKa = 4.02DD96 pKa = 3.71LVDD99 pKa = 5.34FIQKK103 pKa = 10.47GEE105 pKa = 4.2SKK107 pKa = 10.93
Molecular weight: 12.14 kDa
Isoelectric point according different methods:
Protein with the highest isoelectric point:
>tr|A0A1U7NLI0|A0A1U7NLI0_9FIRM Uncharacterized protein OS=Dubosiella newyorkensis OX=1862672 GN=BO225_08040 PE=4 SV=1
MM1 pKa = 7.69LMPKK5 pKa = 8.22RR6 pKa = 11.84TKK8 pKa = 9.71YY9 pKa = 10.1RR10 pKa = 11.84RR11 pKa = 11.84PHH13 pKa = 5.6RR14 pKa = 11.84LSYY17 pKa = 10.34EE18 pKa = 4.05GRR20 pKa = 11.84SKK22 pKa = 11.03AGRR25 pKa = 11.84SVDD28 pKa = 3.8FGEE31 pKa = 4.39YY32 pKa = 10.76GLVAEE37 pKa = 4.7SGNYY41 pKa = 8.93VSNRR45 pKa = 11.84QIEE48 pKa = 4.24AARR51 pKa = 11.84IAMTRR56 pKa = 11.84YY57 pKa = 7.46MKK59 pKa = 10.53RR60 pKa = 11.84GGKK63 pKa = 8.23VWIRR67 pKa = 11.84IFPHH71 pKa = 4.87MARR74 pKa = 11.84TKK76 pKa = 10.47KK77 pKa = 10.0PLEE80 pKa = 3.82VRR82 pKa = 11.84MGSGKK87 pKa = 10.1GAPEE91 pKa = 3.67GWVAVVKK98 pKa = 10.04PGRR101 pKa = 11.84VMFEE105 pKa = 3.64VGGVSEE111 pKa = 4.41EE112 pKa = 4.22VARR115 pKa = 11.84EE116 pKa = 4.03ALRR119 pKa = 11.84LAAHH123 pKa = 7.36KK124 pKa = 10.68LPVKK128 pKa = 9.85TRR130 pKa = 11.84FVRR133 pKa = 11.84KK134 pKa = 10.32GEE136 pKa = 4.09VEE138 pKa = 3.87
MM1 pKa = 7.69LMPKK5 pKa = 8.22RR6 pKa = 11.84TKK8 pKa = 9.71YY9 pKa = 10.1RR10 pKa = 11.84RR11 pKa = 11.84PHH13 pKa = 5.6RR14 pKa = 11.84LSYY17 pKa = 10.34EE18 pKa = 4.05GRR20 pKa = 11.84SKK22 pKa = 11.03AGRR25 pKa = 11.84SVDD28 pKa = 3.8FGEE31 pKa = 4.39YY32 pKa = 10.76GLVAEE37 pKa = 4.7SGNYY41 pKa = 8.93VSNRR45 pKa = 11.84QIEE48 pKa = 4.24AARR51 pKa = 11.84IAMTRR56 pKa = 11.84YY57 pKa = 7.46MKK59 pKa = 10.53RR60 pKa = 11.84GGKK63 pKa = 8.23VWIRR67 pKa = 11.84IFPHH71 pKa = 4.87MARR74 pKa = 11.84TKK76 pKa = 10.47KK77 pKa = 10.0PLEE80 pKa = 3.82VRR82 pKa = 11.84MGSGKK87 pKa = 10.1GAPEE91 pKa = 3.67GWVAVVKK98 pKa = 10.04PGRR101 pKa = 11.84VMFEE105 pKa = 3.64VGGVSEE111 pKa = 4.41EE112 pKa = 4.22VARR115 pKa = 11.84EE116 pKa = 4.03ALRR119 pKa = 11.84LAAHH123 pKa = 7.36KK124 pKa = 10.68LPVKK128 pKa = 9.85TRR130 pKa = 11.84FVRR133 pKa = 11.84KK134 pKa = 10.32GEE136 pKa = 4.09VEE138 pKa = 3.87
Molecular weight: 15.63 kDa
Isoelectric point according different methods:
Peptides (in silico digests for buttom-up proteomics)
Below you can find in silico digests of the whole proteome with Trypsin, Chymotrypsin, Trypsin+LysC, LysN, ArgC proteases suitable for different mass spec machines.| Try ESI |
 |
|---|
| ChTry ESI |
 |
|---|
| ArgC ESI |
 |
|---|
| LysN ESI |
 |
|---|
| TryLysC ESI |
 |
|---|
| Try MALDI |
 |
|---|
| ChTry MALDI |
 |
|---|
| ArgC MALDI |
 |
|---|
| LysN MALDI |
 |
|---|
| TryLysC MALDI |
 |
|---|
| Try LTQ |
 |
|---|
| ChTry LTQ |
 |
|---|
| ArgC LTQ |
 |
|---|
| LysN LTQ |
 |
|---|
| TryLysC LTQ |
 |
|---|
| Try MSlow |
 |
|---|
| ChTry MSlow |
 |
|---|
| ArgC MSlow |
 |
|---|
| LysN MSlow |
 |
|---|
| TryLysC MSlow |
 |
|---|
| Try MShigh |
 |
|---|
| ChTry MShigh |
 |
|---|
| ArgC MShigh |
 |
|---|
| LysN MShigh |
 |
|---|
| TryLysC MShigh |
 |
|---|
General Statistics
Number of major isoforms |
Number of additional isoforms |
Number of all proteins |
Number of amino acids |
Min. Seq. Length |
Max. Seq. Length |
Avg. Seq. Length |
Avg. Mol. Weight |
|---|---|---|---|---|---|---|---|
0 |
664121 |
38 |
4566 |
298.5 |
33.81 |
Amino acid frequency
Ala |
Cys |
Asp |
Glu |
Phe |
Gly |
His |
Ile |
Lys |
Leu |
|---|---|---|---|---|---|---|---|---|---|
6.671 ± 0.057 | 1.26 ± 0.019 |
5.718 ± 0.042 | 7.511 ± 0.063 |
4.465 ± 0.041 | 6.172 ± 0.044 |
2.083 ± 0.021 | 7.901 ± 0.046 |
7.483 ± 0.047 | 9.746 ± 0.058 |
Met |
Asn |
Gln |
Pro |
Arg |
Ser |
Thr |
Val |
Trp |
Tyr |
|---|---|---|---|---|---|---|---|---|---|
2.885 ± 0.031 | 4.529 ± 0.036 |
3.476 ± 0.025 | 4.023 ± 0.039 |
3.902 ± 0.038 | 6.119 ± 0.037 |
4.861 ± 0.047 | 6.156 ± 0.043 |
0.986 ± 0.019 | 4.051 ± 0.035 |
Most of the basic statistics you can see at this page can be downloaded from this CSV file
Proteome-pI is available under Creative Commons Attribution-NoDerivs license, for more details see here
| Reference: Kozlowski LP. Proteome-pI 2.0: Proteome Isoelectric Point Database Update. Nucleic Acids Res. 2021, doi: 10.1093/nar/gkab944 | Contact: Lukasz P. Kozlowski |
