Herbidospora galbida
Taxonomy: cellular organisms; Bacteria; Terrabacteria group; Actinobacteria; Actinomycetia; Streptosporangiales; Streptosporangiaceae; Herbidospora
Average proteome isoelectric point is 6.35
Get precalculated fractions of proteins

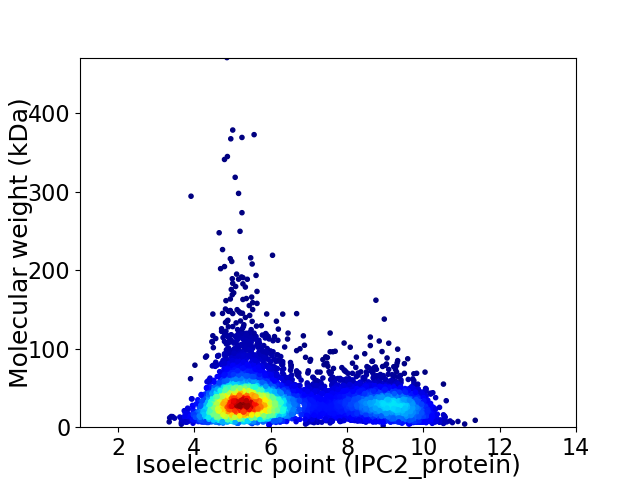
Virtual 2D-PAGE plot for 7514 proteins (isoelectric point calculated using IPC2_protein)
Get csv file with sequences according to given criteria:
* You can choose from 21 different methods for calculating isoelectric point
Summary statistics related to proteome-wise predictions


Protein with the lowest isoelectric point:
>tr|A0A4U3MQV4|A0A4U3MQV4_9ACTN Cupin domain-containing protein OS=Herbidospora galbida OX=2575442 GN=FDA94_01810 PE=4 SV=1
MM1 pKa = 7.42SCGSVTAPDD10 pKa = 4.4PGAGAAPEE18 pKa = 4.36VTTPDD23 pKa = 3.95QIEE26 pKa = 4.3TDD28 pKa = 4.41LDD30 pKa = 4.15PPTDD34 pKa = 4.42PPASDD39 pKa = 4.32CDD41 pKa = 3.79VKK43 pKa = 11.49GEE45 pKa = 4.08NFSEE49 pKa = 4.21DD50 pKa = 3.18VRR52 pKa = 11.84LARR55 pKa = 11.84CLTEE59 pKa = 4.52EE60 pKa = 4.07FWTEE64 pKa = 3.52QFTASGGTYY73 pKa = 9.76QPITRR78 pKa = 11.84FVEE81 pKa = 4.05YY82 pKa = 10.73NGDD85 pKa = 4.04DD86 pKa = 4.01GPDD89 pKa = 3.37CGGQPSVPNNAFYY102 pKa = 11.09CPDD105 pKa = 3.12GHH107 pKa = 7.0FIAYY111 pKa = 8.31DD112 pKa = 3.63ATWLQGLYY120 pKa = 10.54DD121 pKa = 3.9QLGDD125 pKa = 3.44GAVYY129 pKa = 10.1VVIPHH134 pKa = 6.52EE135 pKa = 4.89FGHH138 pKa = 6.07SVQNQLMSNFEE149 pKa = 4.11FSVQAEE155 pKa = 4.22LQADD159 pKa = 4.99CYY161 pKa = 11.37AGGTLKK167 pKa = 11.06GLIDD171 pKa = 4.3GKK173 pKa = 10.56RR174 pKa = 11.84LQAQEE179 pKa = 4.33GDD181 pKa = 4.03DD182 pKa = 4.12AEE184 pKa = 5.18LMANLEE190 pKa = 4.25NAGDD194 pKa = 3.9PTDD197 pKa = 3.98AWWEE201 pKa = 4.06PGAHH205 pKa = 5.62GTAQQRR211 pKa = 11.84QLNFARR217 pKa = 11.84GLEE220 pKa = 4.29SGVGACC226 pKa = 5.52
MM1 pKa = 7.42SCGSVTAPDD10 pKa = 4.4PGAGAAPEE18 pKa = 4.36VTTPDD23 pKa = 3.95QIEE26 pKa = 4.3TDD28 pKa = 4.41LDD30 pKa = 4.15PPTDD34 pKa = 4.42PPASDD39 pKa = 4.32CDD41 pKa = 3.79VKK43 pKa = 11.49GEE45 pKa = 4.08NFSEE49 pKa = 4.21DD50 pKa = 3.18VRR52 pKa = 11.84LARR55 pKa = 11.84CLTEE59 pKa = 4.52EE60 pKa = 4.07FWTEE64 pKa = 3.52QFTASGGTYY73 pKa = 9.76QPITRR78 pKa = 11.84FVEE81 pKa = 4.05YY82 pKa = 10.73NGDD85 pKa = 4.04DD86 pKa = 4.01GPDD89 pKa = 3.37CGGQPSVPNNAFYY102 pKa = 11.09CPDD105 pKa = 3.12GHH107 pKa = 7.0FIAYY111 pKa = 8.31DD112 pKa = 3.63ATWLQGLYY120 pKa = 10.54DD121 pKa = 3.9QLGDD125 pKa = 3.44GAVYY129 pKa = 10.1VVIPHH134 pKa = 6.52EE135 pKa = 4.89FGHH138 pKa = 6.07SVQNQLMSNFEE149 pKa = 4.11FSVQAEE155 pKa = 4.22LQADD159 pKa = 4.99CYY161 pKa = 11.37AGGTLKK167 pKa = 11.06GLIDD171 pKa = 4.3GKK173 pKa = 10.56RR174 pKa = 11.84LQAQEE179 pKa = 4.33GDD181 pKa = 4.03DD182 pKa = 4.12AEE184 pKa = 5.18LMANLEE190 pKa = 4.25NAGDD194 pKa = 3.9PTDD197 pKa = 3.98AWWEE201 pKa = 4.06PGAHH205 pKa = 5.62GTAQQRR211 pKa = 11.84QLNFARR217 pKa = 11.84GLEE220 pKa = 4.29SGVGACC226 pKa = 5.52
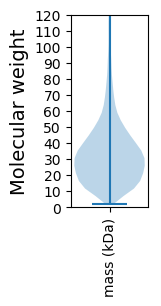
Molecular weight: 24.21 kDa
Isoelectric point according different methods:
Protein with the highest isoelectric point:
>tr|A0A4U3LNE7|A0A4U3LNE7_9ACTN KR domain-containing protein (Fragment) OS=Herbidospora galbida OX=2575442 GN=FDA94_38440 PE=4 SV=1
MM1 pKa = 7.48LRR3 pKa = 11.84RR4 pKa = 11.84RR5 pKa = 11.84PRR7 pKa = 11.84RR8 pKa = 11.84RR9 pKa = 11.84WSRR12 pKa = 11.84RR13 pKa = 11.84PLRR16 pKa = 11.84PPRR19 pKa = 11.84LLPHH23 pKa = 6.71RR24 pKa = 11.84LRR26 pKa = 11.84RR27 pKa = 11.84LRR29 pKa = 11.84LRR31 pKa = 11.84RR32 pKa = 11.84RR33 pKa = 11.84LPRR36 pKa = 11.84LRR38 pKa = 11.84PRR40 pKa = 11.84RR41 pKa = 11.84CSPGPLPPLRR51 pKa = 11.84PPPLRR56 pKa = 11.84PSRR59 pKa = 11.84PRR61 pKa = 11.84PRR63 pKa = 11.84RR64 pKa = 11.84SGRR67 pKa = 11.84RR68 pKa = 11.84PVV70 pKa = 2.89
MM1 pKa = 7.48LRR3 pKa = 11.84RR4 pKa = 11.84RR5 pKa = 11.84PRR7 pKa = 11.84RR8 pKa = 11.84RR9 pKa = 11.84WSRR12 pKa = 11.84RR13 pKa = 11.84PLRR16 pKa = 11.84PPRR19 pKa = 11.84LLPHH23 pKa = 6.71RR24 pKa = 11.84LRR26 pKa = 11.84RR27 pKa = 11.84LRR29 pKa = 11.84LRR31 pKa = 11.84RR32 pKa = 11.84RR33 pKa = 11.84LPRR36 pKa = 11.84LRR38 pKa = 11.84PRR40 pKa = 11.84RR41 pKa = 11.84CSPGPLPPLRR51 pKa = 11.84PPPLRR56 pKa = 11.84PSRR59 pKa = 11.84PRR61 pKa = 11.84PRR63 pKa = 11.84RR64 pKa = 11.84SGRR67 pKa = 11.84RR68 pKa = 11.84PVV70 pKa = 2.89
Molecular weight: 8.77 kDa
Isoelectric point according different methods:
Peptides (in silico digests for buttom-up proteomics)
Below you can find in silico digests of the whole proteome with Trypsin, Chymotrypsin, Trypsin+LysC, LysN, ArgC proteases suitable for different mass spec machines.| Try ESI |
 |
|---|
| ChTry ESI |
 |
|---|
| ArgC ESI |
 |
|---|
| LysN ESI |
 |
|---|
| TryLysC ESI |
 |
|---|
| Try MALDI |
 |
|---|
| ChTry MALDI |
 |
|---|
| ArgC MALDI |
 |
|---|
| LysN MALDI |
 |
|---|
| TryLysC MALDI |
 |
|---|
| Try LTQ |
 |
|---|
| ChTry LTQ |
 |
|---|
| ArgC LTQ |
 |
|---|
| LysN LTQ |
 |
|---|
| TryLysC LTQ |
 |
|---|
| Try MSlow |
 |
|---|
| ChTry MSlow |
 |
|---|
| ArgC MSlow |
 |
|---|
| LysN MSlow |
 |
|---|
| TryLysC MSlow |
 |
|---|
| Try MShigh |
 |
|---|
| ChTry MShigh |
 |
|---|
| ArgC MShigh |
 |
|---|
| LysN MShigh |
 |
|---|
| TryLysC MShigh |
 |
|---|
General Statistics
Number of major isoforms |
Number of additional isoforms |
Number of all proteins |
Number of amino acids |
Min. Seq. Length |
Max. Seq. Length |
Avg. Seq. Length |
Avg. Mol. Weight |
|---|---|---|---|---|---|---|---|
0 |
2491651 |
18 |
4260 |
331.6 |
35.66 |
Amino acid frequency
Ala |
Cys |
Asp |
Glu |
Phe |
Gly |
His |
Ile |
Lys |
Leu |
|---|---|---|---|---|---|---|---|---|---|
12.943 ± 0.037 | 0.742 ± 0.008 |
5.983 ± 0.022 | 5.561 ± 0.024 |
2.994 ± 0.016 | 9.249 ± 0.027 |
2.179 ± 0.013 | 3.74 ± 0.017 |
2.185 ± 0.022 | 10.447 ± 0.037 |
Met |
Asn |
Gln |
Pro |
Arg |
Ser |
Thr |
Val |
Trp |
Tyr |
|---|---|---|---|---|---|---|---|---|---|
1.844 ± 0.012 | 2.002 ± 0.022 |
5.996 ± 0.024 | 2.601 ± 0.015 |
7.846 ± 0.034 | 4.988 ± 0.023 |
6.055 ± 0.031 | 8.861 ± 0.027 |
1.634 ± 0.01 | 2.15 ± 0.014 |
Most of the basic statistics you can see at this page can be downloaded from this CSV file
Proteome-pI is available under Creative Commons Attribution-NoDerivs license, for more details see here
| Reference: Kozlowski LP. Proteome-pI 2.0: Proteome Isoelectric Point Database Update. Nucleic Acids Res. 2021, doi: 10.1093/nar/gkab944 | Contact: Lukasz P. Kozlowski |
