Aureobasidium pullulans EXF-150
Taxonomy: cellular organisms; Eukaryota; Opisthokonta; Fungi; Dikarya; Ascomycota; saccharomyceta; Pezizomycotina; leotiomyceta; dothideomyceta; Dothideomycetes; Dothideomycetidae; Dothideales; Saccotheciaceae; Aureobasidium; Aureobasidium pullulans
Average proteome isoelectric point is 6.51
Get precalculated fractions of proteins

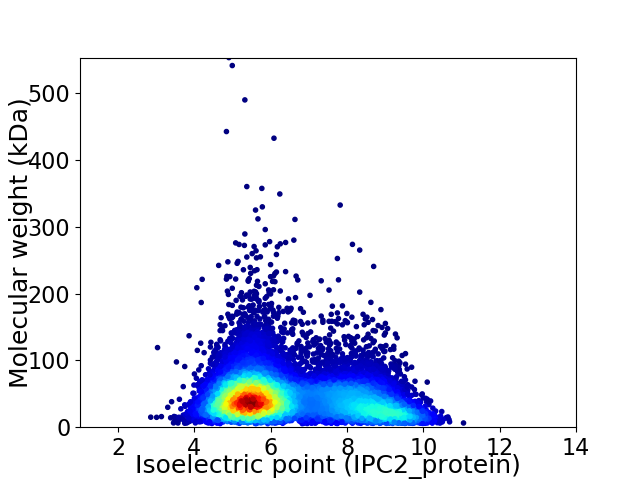
Virtual 2D-PAGE plot for 11844 proteins (isoelectric point calculated using IPC2_protein)
Get csv file with sequences according to given criteria:
* You can choose from 21 different methods for calculating isoelectric point
Summary statistics related to proteome-wise predictions


Protein with the lowest isoelectric point:
>tr|A0A074XYG5|A0A074XYG5_AURPU Uncharacterized protein OS=Aureobasidium pullulans EXF-150 OX=1043002 GN=M438DRAFT_283088 PE=4 SV=1
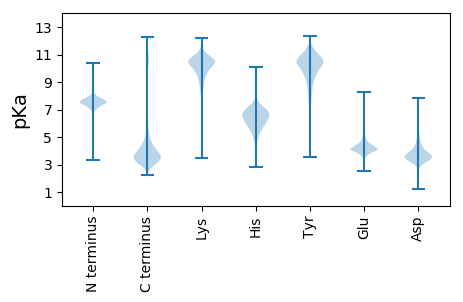
MM1 pKa = 7.3HH2 pKa = 7.68LSTFSLLALSAALANAKK19 pKa = 8.94TDD21 pKa = 3.72LDD23 pKa = 3.82GCTRR27 pKa = 11.84TDD29 pKa = 2.81ISSPAGASYY38 pKa = 11.03AWIVPGTGEE47 pKa = 4.31LCDD50 pKa = 4.58PLDD53 pKa = 4.44CGGGRR58 pKa = 11.84APPKK62 pKa = 8.5TTVPGCAAYY71 pKa = 10.57VGTEE75 pKa = 4.29TYY77 pKa = 10.48SPSYY81 pKa = 10.17LAGSTAPATAAASASAVVTSAEE103 pKa = 3.98VTAAASATATPTAGASDD120 pKa = 4.57DD121 pKa = 4.21NSDD124 pKa = 5.94DD125 pKa = 4.34EE126 pKa = 6.55DD127 pKa = 5.04DD128 pKa = 5.29SNDD131 pKa = 3.59DD132 pKa = 3.8TSDD135 pKa = 3.88DD136 pKa = 4.02SSDD139 pKa = 4.6DD140 pKa = 3.82EE141 pKa = 5.89DD142 pKa = 4.42PLGLAGIDD150 pKa = 3.26AAQEE154 pKa = 3.89STYY157 pKa = 10.36VWRR160 pKa = 11.84TADD163 pKa = 3.54NPTATFNPFTASAFPSDD180 pKa = 4.9VSTFWIPVDD189 pKa = 4.48LGSTTSWEE197 pKa = 4.08AAVPTVLSGGYY208 pKa = 8.27TDD210 pKa = 4.7IVPASMPASSDD221 pKa = 3.35LPAICAIATNSGCGIDD237 pKa = 4.14MSTMTISRR245 pKa = 11.84SQTSTTGSPTSVGTASTSGLSRR267 pKa = 11.84SWVKK271 pKa = 9.65TIPTYY276 pKa = 10.76TRR278 pKa = 11.84VAANDD283 pKa = 3.12AMVRR287 pKa = 11.84AGVSGQSSTSSTASGSASRR306 pKa = 11.84SASASTEE313 pKa = 4.01TSTGAAGKK321 pKa = 9.79VGCAVGGVLAAAMGALIVLL340 pKa = 4.62
MM1 pKa = 7.3HH2 pKa = 7.68LSTFSLLALSAALANAKK19 pKa = 8.94TDD21 pKa = 3.72LDD23 pKa = 3.82GCTRR27 pKa = 11.84TDD29 pKa = 2.81ISSPAGASYY38 pKa = 11.03AWIVPGTGEE47 pKa = 4.31LCDD50 pKa = 4.58PLDD53 pKa = 4.44CGGGRR58 pKa = 11.84APPKK62 pKa = 8.5TTVPGCAAYY71 pKa = 10.57VGTEE75 pKa = 4.29TYY77 pKa = 10.48SPSYY81 pKa = 10.17LAGSTAPATAAASASAVVTSAEE103 pKa = 3.98VTAAASATATPTAGASDD120 pKa = 4.57DD121 pKa = 4.21NSDD124 pKa = 5.94DD125 pKa = 4.34EE126 pKa = 6.55DD127 pKa = 5.04DD128 pKa = 5.29SNDD131 pKa = 3.59DD132 pKa = 3.8TSDD135 pKa = 3.88DD136 pKa = 4.02SSDD139 pKa = 4.6DD140 pKa = 3.82EE141 pKa = 5.89DD142 pKa = 4.42PLGLAGIDD150 pKa = 3.26AAQEE154 pKa = 3.89STYY157 pKa = 10.36VWRR160 pKa = 11.84TADD163 pKa = 3.54NPTATFNPFTASAFPSDD180 pKa = 4.9VSTFWIPVDD189 pKa = 4.48LGSTTSWEE197 pKa = 4.08AAVPTVLSGGYY208 pKa = 8.27TDD210 pKa = 4.7IVPASMPASSDD221 pKa = 3.35LPAICAIATNSGCGIDD237 pKa = 4.14MSTMTISRR245 pKa = 11.84SQTSTTGSPTSVGTASTSGLSRR267 pKa = 11.84SWVKK271 pKa = 9.65TIPTYY276 pKa = 10.76TRR278 pKa = 11.84VAANDD283 pKa = 3.12AMVRR287 pKa = 11.84AGVSGQSSTSSTASGSASRR306 pKa = 11.84SASASTEE313 pKa = 4.01TSTGAAGKK321 pKa = 9.79VGCAVGGVLAAAMGALIVLL340 pKa = 4.62
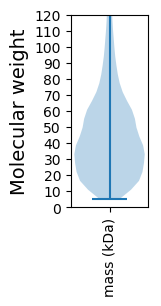
Molecular weight: 33.49 kDa
Isoelectric point according different methods:
Protein with the highest isoelectric point:
>tr|A0A074Y258|A0A074Y258_AURPU Uncharacterized protein OS=Aureobasidium pullulans EXF-150 OX=1043002 GN=M438DRAFT_394009 PE=3 SV=1
MM1 pKa = 7.88PSHH4 pKa = 6.91KK5 pKa = 10.39SFRR8 pKa = 11.84TKK10 pKa = 10.45QKK12 pKa = 9.84LAKK15 pKa = 9.55AQKK18 pKa = 8.59QNRR21 pKa = 11.84PIPQWIRR28 pKa = 11.84LRR30 pKa = 11.84TNNTIRR36 pKa = 11.84YY37 pKa = 5.73NAKK40 pKa = 8.89RR41 pKa = 11.84RR42 pKa = 11.84HH43 pKa = 4.15WRR45 pKa = 11.84KK46 pKa = 7.38TRR48 pKa = 11.84IGII51 pKa = 4.0
MM1 pKa = 7.88PSHH4 pKa = 6.91KK5 pKa = 10.39SFRR8 pKa = 11.84TKK10 pKa = 10.45QKK12 pKa = 9.84LAKK15 pKa = 9.55AQKK18 pKa = 8.59QNRR21 pKa = 11.84PIPQWIRR28 pKa = 11.84LRR30 pKa = 11.84TNNTIRR36 pKa = 11.84YY37 pKa = 5.73NAKK40 pKa = 8.89RR41 pKa = 11.84RR42 pKa = 11.84HH43 pKa = 4.15WRR45 pKa = 11.84KK46 pKa = 7.38TRR48 pKa = 11.84IGII51 pKa = 4.0
Molecular weight: 6.31 kDa
Isoelectric point according different methods:
Peptides (in silico digests for buttom-up proteomics)
Below you can find in silico digests of the whole proteome with Trypsin, Chymotrypsin, Trypsin+LysC, LysN, ArgC proteases suitable for different mass spec machines.| Try ESI |
 |
|---|
| ChTry ESI |
 |
|---|
| ArgC ESI |
 |
|---|
| LysN ESI |
 |
|---|
| TryLysC ESI |
 |
|---|
| Try MALDI |
 |
|---|
| ChTry MALDI |
 |
|---|
| ArgC MALDI |
 |
|---|
| LysN MALDI |
 |
|---|
| TryLysC MALDI |
 |
|---|
| Try LTQ |
 |
|---|
| ChTry LTQ |
 |
|---|
| ArgC LTQ |
 |
|---|
| LysN LTQ |
 |
|---|
| TryLysC LTQ |
 |
|---|
| Try MSlow |
 |
|---|
| ChTry MSlow |
 |
|---|
| ArgC MSlow |
 |
|---|
| LysN MSlow |
 |
|---|
| TryLysC MSlow |
 |
|---|
| Try MShigh |
 |
|---|
| ChTry MShigh |
 |
|---|
| ArgC MShigh |
 |
|---|
| LysN MShigh |
 |
|---|
| TryLysC MShigh |
 |
|---|
General Statistics
Number of major isoforms |
Number of additional isoforms |
Number of all proteins |
Number of amino acids |
Min. Seq. Length |
Max. Seq. Length |
Avg. Seq. Length |
Avg. Mol. Weight |
|---|---|---|---|---|---|---|---|
0 |
5256702 |
49 |
4975 |
443.8 |
49.15 |
Amino acid frequency
Ala |
Cys |
Asp |
Glu |
Phe |
Gly |
His |
Ile |
Lys |
Leu |
|---|---|---|---|---|---|---|---|---|---|
8.752 ± 0.022 | 1.281 ± 0.009 |
5.774 ± 0.018 | 6.03 ± 0.026 |
3.752 ± 0.014 | 6.535 ± 0.023 |
2.454 ± 0.012 | 4.929 ± 0.018 |
4.99 ± 0.021 | 8.788 ± 0.025 |
Met |
Asn |
Gln |
Pro |
Arg |
Ser |
Thr |
Val |
Trp |
Tyr |
|---|---|---|---|---|---|---|---|---|---|
2.274 ± 0.01 | 3.822 ± 0.013 |
5.821 ± 0.027 | 4.18 ± 0.018 |
5.814 ± 0.022 | 8.359 ± 0.026 |
6.143 ± 0.017 | 6.043 ± 0.018 |
1.455 ± 0.009 | 2.804 ± 0.013 |
Most of the basic statistics you can see at this page can be downloaded from this CSV file
Proteome-pI is available under Creative Commons Attribution-NoDerivs license, for more details see here
| Reference: Kozlowski LP. Proteome-pI 2.0: Proteome Isoelectric Point Database Update. Nucleic Acids Res. 2021, doi: 10.1093/nar/gkab944 | Contact: Lukasz P. Kozlowski |
