Klebsiella phage ST16-OXA48phi5.3
Taxonomy: Viruses; Duplodnaviria; Heunggongvirae; Uroviricota; Caudoviricetes; Caudovirales; Siphoviridae; unclassified Siphoviridae
Average proteome isoelectric point is 6.83
Get precalculated fractions of proteins
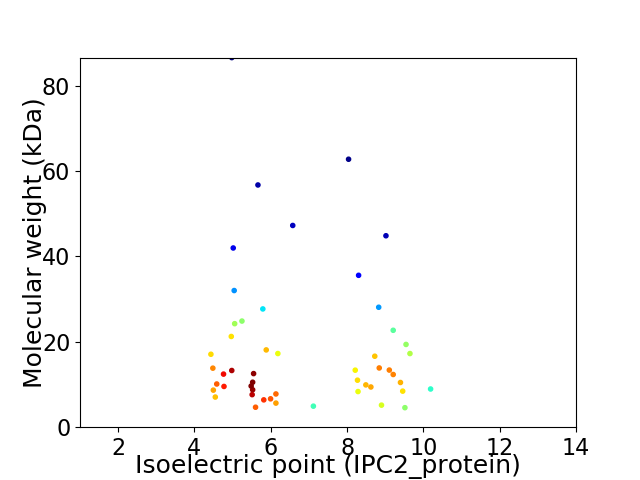
Virtual 2D-PAGE plot for 51 proteins (isoelectric point calculated using IPC2_protein)
Get csv file with sequences according to given criteria:
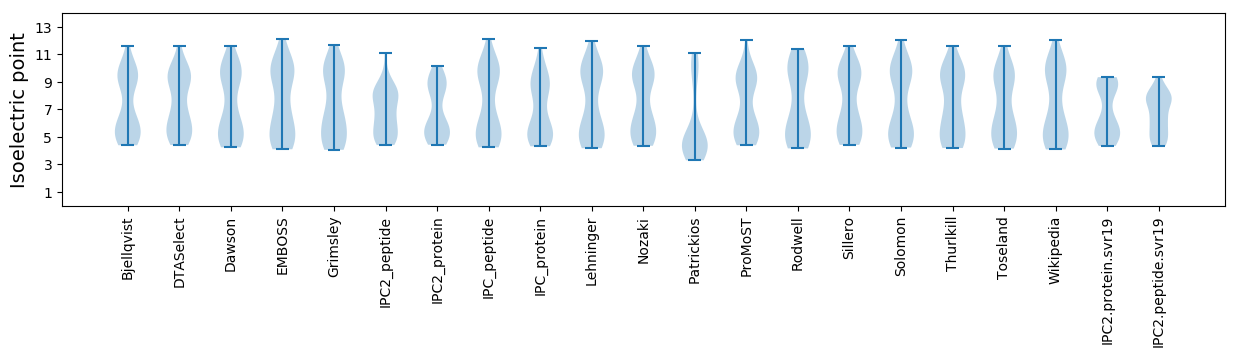
* You can choose from 21 different methods for calculating isoelectric point
Summary statistics related to proteome-wise predictions
Protein with the lowest isoelectric point:
>tr|A0A482ILW3|A0A482ILW3_9CAUD Uncharacterized protein OS=Klebsiella phage ST16-OXA48phi5.3 OX=2510482 PE=4 SV=1
MM1 pKa = 7.6IAPIFAVCAASQAVRR16 pKa = 11.84DD17 pKa = 4.25LLGSTPVRR25 pKa = 11.84LYY27 pKa = 10.48PFGMQDD33 pKa = 3.56DD34 pKa = 4.84NIVYY38 pKa = 9.06PYY40 pKa = 11.02AVWQNVGGFPEE51 pKa = 4.72NYY53 pKa = 9.94LNQRR57 pKa = 11.84PDD59 pKa = 3.33ADD61 pKa = 3.91HH62 pKa = 6.96YY63 pKa = 11.15SLQVDD68 pKa = 4.27VYY70 pKa = 10.79GDD72 pKa = 3.44TDD74 pKa = 3.61TDD76 pKa = 3.97VIAVARR82 pKa = 11.84ALRR85 pKa = 11.84DD86 pKa = 4.0AIEE89 pKa = 4.31GKK91 pKa = 10.57AYY93 pKa = 7.31ITRR96 pKa = 11.84WGEE99 pKa = 3.6QSRR102 pKa = 11.84DD103 pKa = 3.8PEE105 pKa = 4.36TMRR108 pKa = 11.84YY109 pKa = 9.44RR110 pKa = 11.84YY111 pKa = 10.46SFDD114 pKa = 3.35VDD116 pKa = 4.19WITTRR121 pKa = 3.64
MM1 pKa = 7.6IAPIFAVCAASQAVRR16 pKa = 11.84DD17 pKa = 4.25LLGSTPVRR25 pKa = 11.84LYY27 pKa = 10.48PFGMQDD33 pKa = 3.56DD34 pKa = 4.84NIVYY38 pKa = 9.06PYY40 pKa = 11.02AVWQNVGGFPEE51 pKa = 4.72NYY53 pKa = 9.94LNQRR57 pKa = 11.84PDD59 pKa = 3.33ADD61 pKa = 3.91HH62 pKa = 6.96YY63 pKa = 11.15SLQVDD68 pKa = 4.27VYY70 pKa = 10.79GDD72 pKa = 3.44TDD74 pKa = 3.61TDD76 pKa = 3.97VIAVARR82 pKa = 11.84ALRR85 pKa = 11.84DD86 pKa = 4.0AIEE89 pKa = 4.31GKK91 pKa = 10.57AYY93 pKa = 7.31ITRR96 pKa = 11.84WGEE99 pKa = 3.6QSRR102 pKa = 11.84DD103 pKa = 3.8PEE105 pKa = 4.36TMRR108 pKa = 11.84YY109 pKa = 9.44RR110 pKa = 11.84YY111 pKa = 10.46SFDD114 pKa = 3.35VDD116 pKa = 4.19WITTRR121 pKa = 3.64
Molecular weight: 13.83 kDa
Isoelectric point according different methods:
Protein with the highest isoelectric point:
>tr|A0A482IIU0|A0A482IIU0_9CAUD Uncharacterized protein OS=Klebsiella phage ST16-OXA48phi5.3 OX=2510482 PE=4 SV=1
MM1 pKa = 7.7IDD3 pKa = 3.41NRR5 pKa = 11.84TVSAIDD11 pKa = 3.79LALQKK16 pKa = 10.72HH17 pKa = 5.26PTPVGDD23 pKa = 4.01LFAAIRR29 pKa = 11.84HH30 pKa = 5.09GRR32 pKa = 11.84MKK34 pKa = 10.47RR35 pKa = 11.84CFSRR39 pKa = 11.84DD40 pKa = 2.83TAIRR44 pKa = 11.84YY45 pKa = 7.74LAFFMTSRR53 pKa = 11.84AFGRR57 pKa = 11.84SGFKK61 pKa = 9.87QRR63 pKa = 11.84YY64 pKa = 7.55PDD66 pKa = 3.42VQVIHH71 pKa = 6.88PLNPEE76 pKa = 3.9LSSWQRR82 pKa = 11.84GAVTLEE88 pKa = 3.81YY89 pKa = 10.66FNAHH93 pKa = 4.55QRR95 pKa = 11.84TVRR98 pKa = 11.84RR99 pKa = 11.84LRR101 pKa = 11.84RR102 pKa = 11.84ILARR106 pKa = 11.84KK107 pKa = 9.79RR108 pKa = 11.84EE109 pKa = 3.97MQKK112 pKa = 9.29WCEE115 pKa = 3.94KK116 pKa = 8.46WDD118 pKa = 3.72AMHH121 pKa = 7.29DD122 pKa = 3.64RR123 pKa = 11.84YY124 pKa = 11.06VKK126 pKa = 10.27EE127 pKa = 4.1RR128 pKa = 11.84EE129 pKa = 3.83EE130 pKa = 4.08LQASKK135 pKa = 9.97PAEE138 pKa = 3.83VRR140 pKa = 11.84NASQHH145 pKa = 4.66AA146 pKa = 3.53
MM1 pKa = 7.7IDD3 pKa = 3.41NRR5 pKa = 11.84TVSAIDD11 pKa = 3.79LALQKK16 pKa = 10.72HH17 pKa = 5.26PTPVGDD23 pKa = 4.01LFAAIRR29 pKa = 11.84HH30 pKa = 5.09GRR32 pKa = 11.84MKK34 pKa = 10.47RR35 pKa = 11.84CFSRR39 pKa = 11.84DD40 pKa = 2.83TAIRR44 pKa = 11.84YY45 pKa = 7.74LAFFMTSRR53 pKa = 11.84AFGRR57 pKa = 11.84SGFKK61 pKa = 9.87QRR63 pKa = 11.84YY64 pKa = 7.55PDD66 pKa = 3.42VQVIHH71 pKa = 6.88PLNPEE76 pKa = 3.9LSSWQRR82 pKa = 11.84GAVTLEE88 pKa = 3.81YY89 pKa = 10.66FNAHH93 pKa = 4.55QRR95 pKa = 11.84TVRR98 pKa = 11.84RR99 pKa = 11.84LRR101 pKa = 11.84RR102 pKa = 11.84ILARR106 pKa = 11.84KK107 pKa = 9.79RR108 pKa = 11.84EE109 pKa = 3.97MQKK112 pKa = 9.29WCEE115 pKa = 3.94KK116 pKa = 8.46WDD118 pKa = 3.72AMHH121 pKa = 7.29DD122 pKa = 3.64RR123 pKa = 11.84YY124 pKa = 11.06VKK126 pKa = 10.27EE127 pKa = 4.1RR128 pKa = 11.84EE129 pKa = 3.83EE130 pKa = 4.08LQASKK135 pKa = 9.97PAEE138 pKa = 3.83VRR140 pKa = 11.84NASQHH145 pKa = 4.66AA146 pKa = 3.53
Molecular weight: 17.25 kDa
Isoelectric point according different methods:
Peptides (in silico digests for buttom-up proteomics)
Below you can find in silico digests of the whole proteome with Trypsin, Chymotrypsin, Trypsin+LysC, LysN, ArgC proteases suitable for different mass spec machines.| Try ESI |
 |
|---|
| ChTry ESI |
|
|---|
| ArgC ESI |
|
|---|
| LysN ESI |
|
|---|
| TryLysC ESI |
|
|---|
| Try MALDI |
|
|---|
| ChTry MALDI |
|
|---|
| ArgC MALDI |
|
|---|
| LysN MALDI |
|
|---|
| TryLysC MALDI |
|
|---|
| Try LTQ |
|
|---|
| ChTry LTQ |
|
|---|
| ArgC LTQ |
|
|---|
| LysN LTQ |
|
|---|
| TryLysC LTQ |
|
|---|
| Try MSlow |
|
|---|
| ChTry MSlow |
|
|---|
| ArgC MSlow |
|
|---|
| LysN MSlow |
|
|---|
| TryLysC MSlow |
|
|---|
| Try MShigh |
|
|---|
| ChTry MShigh |
|
|---|
| ArgC MShigh |
|
|---|
| LysN MShigh |
|
|---|
| TryLysC MShigh |
|
|---|
General Statistics
Number of major isoforms |
Number of additional isoforms |
Number of all proteins |
Number of amino acids |
Min. Seq. Length |
Max. Seq. Length |
Avg. Seq. Length |
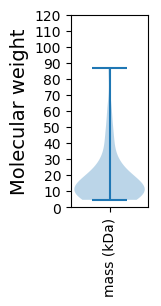
Avg. Mol. Weight |
|---|---|---|---|---|---|---|---|
0 |
8567 |
39 |
815 |
168.0 |
18.66 |
Amino acid frequency
Ala |
Cys |
Asp |
Glu |
Phe |
Gly |
His |
Ile |
Lys |
Leu |
|---|---|---|---|---|---|---|---|---|---|
9.77 ± 0.567 | 1.062 ± 0.227 |
5.673 ± 0.269 | 6.397 ± 0.307 |
3.84 ± 0.199 | 7.074 ± 0.392 |
1.903 ± 0.239 | 5.918 ± 0.263 |
5.86 ± 0.343 | 9.046 ± 0.418 |
Met |
Asn |
Gln |
Pro |
Arg |
Ser |
Thr |
Val |
Trp |
Tyr |
|---|---|---|---|---|---|---|---|---|---|
2.801 ± 0.193 | 4.004 ± 0.194 |
4.226 ± 0.357 | 4.155 ± 0.329 |
6.292 ± 0.52 | 6.397 ± 0.286 |
5.404 ± 0.246 | 6.28 ± 0.211 |
1.354 ± 0.147 | 2.545 ± 0.19 |
Most of the basic statistics you can see at this page can be downloaded from this CSV file
See this proteome in:

Proteome-pI is available under Creative Commons Attribution-NoDerivs license, for more details see here
| Reference: Kozlowski LP. Proteome-pI 2.0: Proteome Isoelectric Point Database Update. Nucleic Acids Res. 2021, doi: 10.1093/nar/gkab944 | Contact: Lukasz P. Kozlowski |