Felis catus (Cat) (Felis silvestris catus)
Taxonomy: cellular organisms; Eukaryota; Opisthokonta; Metazoa; Eumetazoa; Bilateria; Deuterostomia; Chordata; Craniata; Vertebrata; Gnathostomata; Teleostomi; Euteleostomi; Sarcopterygii; Dipnotetrapodomorpha; Tetrapoda; Amniota; Mammalia; Theria; Euther
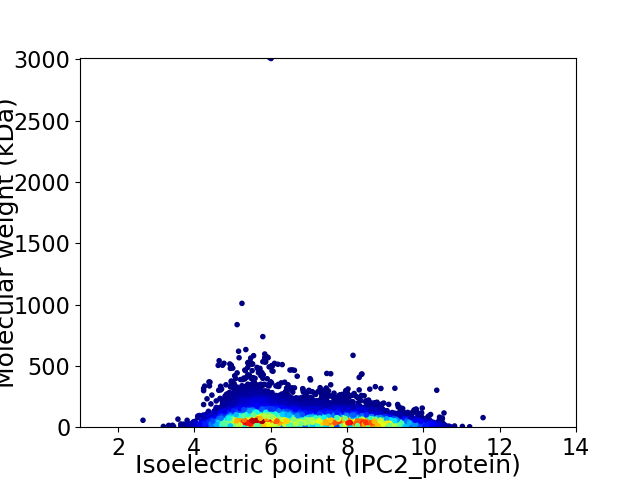
Average proteome isoelectric point is 6.79
Get precalculated fractions of proteins

Virtual 2D-PAGE plot for 40225 proteins (isoelectric point calculated using IPC2_protein)
Get csv file with sequences according to given criteria:
* You can choose from 21 different methods for calculating isoelectric point
Summary statistics related to proteome-wise predictions


Protein with the lowest isoelectric point:
>tr|M3WPP3|M3WPP3_FELCA Spermatogenesis associated 5 like 1 OS=Felis catus OX=9685 GN=SPATA5L1 PE=4 SV=4
MM1 pKa = 7.22EE2 pKa = 5.09AVVLIPYY9 pKa = 9.99VLGLLLLPLLAVVLCVRR26 pKa = 11.84CRR28 pKa = 11.84EE29 pKa = 4.27LPGSYY34 pKa = 10.75DD35 pKa = 3.3NTASDD40 pKa = 3.94SLAPSSIVIKK50 pKa = 10.5RR51 pKa = 11.84PPTLATWTPATSYY64 pKa = 10.76PPVTSYY70 pKa = 11.28PPLSQPDD77 pKa = 4.23LLPIPRR83 pKa = 11.84SPQPPGGSHH92 pKa = 6.82RR93 pKa = 11.84MPSSRR98 pKa = 11.84QDD100 pKa = 2.92SDD102 pKa = 3.47GANSVASYY110 pKa = 10.71EE111 pKa = 4.2NEE113 pKa = 3.86EE114 pKa = 4.31PACEE118 pKa = 5.26DD119 pKa = 3.55DD120 pKa = 6.59DD121 pKa = 4.6EE122 pKa = 6.88DD123 pKa = 5.49EE124 pKa = 4.94EE125 pKa = 4.44EE126 pKa = 4.91DD127 pKa = 4.15YY128 pKa = 11.46PNEE131 pKa = 4.39GYY133 pKa = 11.04LEE135 pKa = 4.18VLPDD139 pKa = 3.57STPATGTAVPPAPAPSNPGLRR160 pKa = 11.84DD161 pKa = 3.14SAFSMEE167 pKa = 4.23SGEE170 pKa = 4.99DD171 pKa = 3.63YY172 pKa = 11.66VNVPEE177 pKa = 4.61SEE179 pKa = 4.19EE180 pKa = 4.19SADD183 pKa = 3.6VSLDD187 pKa = 3.29GSRR190 pKa = 11.84EE191 pKa = 3.96YY192 pKa = 11.72VNVSQEE198 pKa = 4.24LPPVARR204 pKa = 11.84TEE206 pKa = 3.93PAILSSQNDD215 pKa = 3.92DD216 pKa = 4.02EE217 pKa = 5.46EE218 pKa = 5.21EE219 pKa = 4.2GAPDD223 pKa = 3.75YY224 pKa = 11.56EE225 pKa = 4.31NLQGLNN231 pKa = 3.55
MM1 pKa = 7.22EE2 pKa = 5.09AVVLIPYY9 pKa = 9.99VLGLLLLPLLAVVLCVRR26 pKa = 11.84CRR28 pKa = 11.84EE29 pKa = 4.27LPGSYY34 pKa = 10.75DD35 pKa = 3.3NTASDD40 pKa = 3.94SLAPSSIVIKK50 pKa = 10.5RR51 pKa = 11.84PPTLATWTPATSYY64 pKa = 10.76PPVTSYY70 pKa = 11.28PPLSQPDD77 pKa = 4.23LLPIPRR83 pKa = 11.84SPQPPGGSHH92 pKa = 6.82RR93 pKa = 11.84MPSSRR98 pKa = 11.84QDD100 pKa = 2.92SDD102 pKa = 3.47GANSVASYY110 pKa = 10.71EE111 pKa = 4.2NEE113 pKa = 3.86EE114 pKa = 4.31PACEE118 pKa = 5.26DD119 pKa = 3.55DD120 pKa = 6.59DD121 pKa = 4.6EE122 pKa = 6.88DD123 pKa = 5.49EE124 pKa = 4.94EE125 pKa = 4.44EE126 pKa = 4.91DD127 pKa = 4.15YY128 pKa = 11.46PNEE131 pKa = 4.39GYY133 pKa = 11.04LEE135 pKa = 4.18VLPDD139 pKa = 3.57STPATGTAVPPAPAPSNPGLRR160 pKa = 11.84DD161 pKa = 3.14SAFSMEE167 pKa = 4.23SGEE170 pKa = 4.99DD171 pKa = 3.63YY172 pKa = 11.66VNVPEE177 pKa = 4.61SEE179 pKa = 4.19EE180 pKa = 4.19SADD183 pKa = 3.6VSLDD187 pKa = 3.29GSRR190 pKa = 11.84EE191 pKa = 3.96YY192 pKa = 11.72VNVSQEE198 pKa = 4.24LPPVARR204 pKa = 11.84TEE206 pKa = 3.93PAILSSQNDD215 pKa = 3.92DD216 pKa = 4.02EE217 pKa = 5.46EE218 pKa = 5.21EE219 pKa = 4.2GAPDD223 pKa = 3.75YY224 pKa = 11.56EE225 pKa = 4.31NLQGLNN231 pKa = 3.55
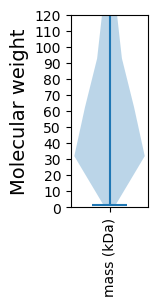
Molecular weight: 24.73 kDa
Isoelectric point according different methods:
Protein with the highest isoelectric point:
>sp|Q6SA95|FA9_FELCA Coagulation factor IX OS=Felis catus OX=9685 GN=F9 PE=3 SV=1
MM1 pKa = 7.1RR2 pKa = 11.84AKK4 pKa = 9.12WRR6 pKa = 11.84KK7 pKa = 9.1KK8 pKa = 9.32RR9 pKa = 11.84MRR11 pKa = 11.84RR12 pKa = 11.84LKK14 pKa = 10.08RR15 pKa = 11.84KK16 pKa = 8.21RR17 pKa = 11.84RR18 pKa = 11.84KK19 pKa = 8.46MRR21 pKa = 11.84QRR23 pKa = 11.84SKK25 pKa = 11.41
MM1 pKa = 7.1RR2 pKa = 11.84AKK4 pKa = 9.12WRR6 pKa = 11.84KK7 pKa = 9.1KK8 pKa = 9.32RR9 pKa = 11.84MRR11 pKa = 11.84RR12 pKa = 11.84LKK14 pKa = 10.08RR15 pKa = 11.84KK16 pKa = 8.21RR17 pKa = 11.84RR18 pKa = 11.84KK19 pKa = 8.46MRR21 pKa = 11.84QRR23 pKa = 11.84SKK25 pKa = 11.41
Molecular weight: 3.46 kDa
Isoelectric point according different methods:
Peptides (in silico digests for buttom-up proteomics)
Below you can find in silico digests of the whole proteome with Trypsin, Chymotrypsin, Trypsin+LysC, LysN, ArgC proteases suitable for different mass spec machines.| Try ESI |
 |
|---|
| ChTry ESI |
 |
|---|
| ArgC ESI |
 |
|---|
| LysN ESI |
 |
|---|
| TryLysC ESI |
 |
|---|
| Try MALDI |
 |
|---|
| ChTry MALDI |
 |
|---|
| ArgC MALDI |
 |
|---|
| LysN MALDI |
 |
|---|
| TryLysC MALDI |
 |
|---|
| Try LTQ |
 |
|---|
| ChTry LTQ |
 |
|---|
| ArgC LTQ |
 |
|---|
| LysN LTQ |
 |
|---|
| TryLysC LTQ |
 |
|---|
| Try MSlow |
 |
|---|
| ChTry MSlow |
 |
|---|
| ArgC MSlow |
 |
|---|
| LysN MSlow |
 |
|---|
| TryLysC MSlow |
 |
|---|
| Try MShigh |
 |
|---|
| ChTry MShigh |
 |
|---|
| ArgC MShigh |
 |
|---|
| LysN MShigh |
 |
|---|
| TryLysC MShigh |
 |
|---|
General Statistics
Number of major isoforms |
Number of additional isoforms |
Number of all proteins |
Number of amino acids |
Min. Seq. Length |
Max. Seq. Length |
Avg. Seq. Length |
Avg. Mol. Weight |
|---|---|---|---|---|---|---|---|
24765678 |
13 |
27108 |
615.7 |
68.5 |
Amino acid frequency
Ala |
Cys |
Asp |
Glu |
Phe |
Gly |
His |
Ile |
Lys |
Leu |
|---|---|---|---|---|---|---|---|---|---|
7.097 ± 0.014 | 2.194 ± 0.01 |
4.803 ± 0.008 | 7.082 ± 0.015 |
3.589 ± 0.008 | 6.672 ± 0.016 |
2.565 ± 0.007 | 4.301 ± 0.012 |
5.662 ± 0.015 | 9.83 ± 0.018 |
Met |
Asn |
Gln |
Pro |
Arg |
Ser |
Thr |
Val |
Trp |
Tyr |
|---|---|---|---|---|---|---|---|---|---|
2.093 ± 0.005 | 3.572 ± 0.01 |
6.514 ± 0.02 | 4.726 ± 0.01 |
5.851 ± 0.012 | 8.355 ± 0.016 |
5.269 ± 0.009 | 6.013 ± 0.012 |
1.2 ± 0.004 | 2.61 ± 0.007 |
Most of the basic statistics you can see at this page can be downloaded from this CSV file
Proteome-pI is available under Creative Commons Attribution-NoDerivs license, for more details see here
| Reference: Kozlowski LP. Proteome-pI 2.0: Proteome Isoelectric Point Database Update. Nucleic Acids Res. 2021, doi: 10.1093/nar/gkab944 | Contact: Lukasz P. Kozlowski |
