Haemophilus phage HP1 (strain HP1c1) (Bacteriophage HP1)
Taxonomy: Viruses; Duplodnaviria; Heunggongvirae; Uroviricota; Caudoviricetes; Caudovirales; Myoviridae; Peduovirinae; Hpunavirus; Haemophilus virus HP1
Average proteome isoelectric point is 6.71
Get precalculated fractions of proteins

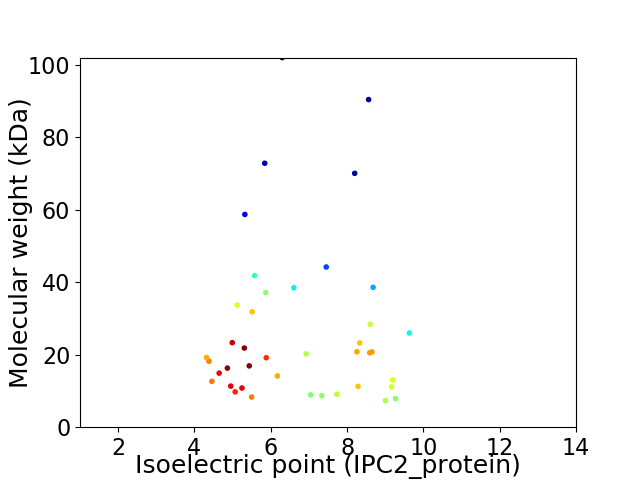
Virtual 2D-PAGE plot for 41 proteins (isoelectric point calculated using IPC2_protein)
Get csv file with sequences according to given criteria:
* You can choose from 21 different methods for calculating isoelectric point
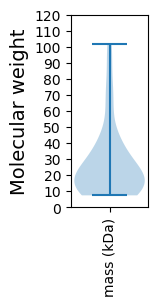
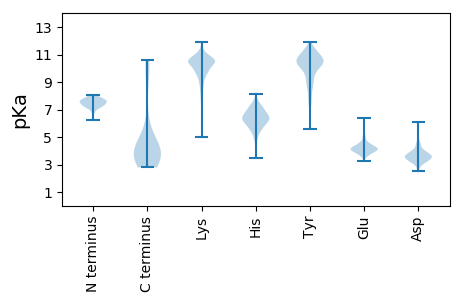
Summary statistics related to proteome-wise predictions


Protein with the lowest isoelectric point:
>sp|P51724|YO22_BPHC1 Uncharacterized 26.0 kDa protein in rep-hol intergenic region OS=Haemophilus phage HP1 (strain HP1c1) OX=1289570 PE=4 SV=1
MM1 pKa = 7.14ATVKK5 pKa = 10.63KK6 pKa = 9.83MLYY9 pKa = 8.92QQLTAFLLTKK19 pKa = 10.33LPKK22 pKa = 9.49RR23 pKa = 11.84YY24 pKa = 9.56HH25 pKa = 6.21GNFYY29 pKa = 10.93SWIEE33 pKa = 3.96DD34 pKa = 3.07GKK36 pKa = 11.04LLNEE40 pKa = 4.22GRR42 pKa = 11.84QVTEE46 pKa = 3.93NGIEE50 pKa = 4.2VCHH53 pKa = 6.73LSYY56 pKa = 11.3NGVFHH61 pKa = 7.48FEE63 pKa = 3.71ALPFNEE69 pKa = 4.4ISPAYY74 pKa = 10.22LMAHH78 pKa = 5.4IQVWVNEE85 pKa = 4.32NDD87 pKa = 3.42PMRR90 pKa = 11.84DD91 pKa = 3.31VLDD94 pKa = 4.02EE95 pKa = 4.34SEE97 pKa = 4.82IPFDD101 pKa = 5.72LDD103 pKa = 4.41IIDD106 pKa = 5.96DD107 pKa = 4.04NTTDD111 pKa = 5.25LIFTIAFRR119 pKa = 11.84EE120 pKa = 4.28PLTAMEE126 pKa = 4.97DD127 pKa = 3.61NEE129 pKa = 4.78GEE131 pKa = 4.18LKK133 pKa = 10.14IDD135 pKa = 3.54GVNYY139 pKa = 10.23RR140 pKa = 11.84LDD142 pKa = 4.12EE143 pKa = 4.59IEE145 pKa = 4.36VFTAEE150 pKa = 4.36EE151 pKa = 3.83IDD153 pKa = 3.67VVVRR157 pKa = 11.84VEE159 pKa = 4.22HH160 pKa = 5.74EE161 pKa = 4.37HH162 pKa = 6.79PNGDD166 pKa = 3.3
MM1 pKa = 7.14ATVKK5 pKa = 10.63KK6 pKa = 9.83MLYY9 pKa = 8.92QQLTAFLLTKK19 pKa = 10.33LPKK22 pKa = 9.49RR23 pKa = 11.84YY24 pKa = 9.56HH25 pKa = 6.21GNFYY29 pKa = 10.93SWIEE33 pKa = 3.96DD34 pKa = 3.07GKK36 pKa = 11.04LLNEE40 pKa = 4.22GRR42 pKa = 11.84QVTEE46 pKa = 3.93NGIEE50 pKa = 4.2VCHH53 pKa = 6.73LSYY56 pKa = 11.3NGVFHH61 pKa = 7.48FEE63 pKa = 3.71ALPFNEE69 pKa = 4.4ISPAYY74 pKa = 10.22LMAHH78 pKa = 5.4IQVWVNEE85 pKa = 4.32NDD87 pKa = 3.42PMRR90 pKa = 11.84DD91 pKa = 3.31VLDD94 pKa = 4.02EE95 pKa = 4.34SEE97 pKa = 4.82IPFDD101 pKa = 5.72LDD103 pKa = 4.41IIDD106 pKa = 5.96DD107 pKa = 4.04NTTDD111 pKa = 5.25LIFTIAFRR119 pKa = 11.84EE120 pKa = 4.28PLTAMEE126 pKa = 4.97DD127 pKa = 3.61NEE129 pKa = 4.78GEE131 pKa = 4.18LKK133 pKa = 10.14IDD135 pKa = 3.54GVNYY139 pKa = 10.23RR140 pKa = 11.84LDD142 pKa = 4.12EE143 pKa = 4.59IEE145 pKa = 4.36VFTAEE150 pKa = 4.36EE151 pKa = 3.83IDD153 pKa = 3.67VVVRR157 pKa = 11.84VEE159 pKa = 4.22HH160 pKa = 5.74EE161 pKa = 4.37HH162 pKa = 6.79PNGDD166 pKa = 3.3
Molecular weight: 19.23 kDa
Isoelectric point according different methods:
Protein with the highest isoelectric point:
>sp|P51702|YO03_BPHC1 Uncharacterized 8.9 kDa protein in int-C1 intergenic region OS=Haemophilus phage HP1 (strain HP1c1) OX=1289570 PE=4 SV=1
MM1 pKa = 7.77LINVSIKK8 pKa = 10.38LIKK11 pKa = 10.12LYY13 pKa = 10.59QRR15 pKa = 11.84LAPQKK20 pKa = 10.41IRR22 pKa = 11.84DD23 pKa = 3.55ACRR26 pKa = 11.84FEE28 pKa = 4.46PTCSNYY34 pKa = 10.73AILALQKK41 pKa = 10.32YY42 pKa = 7.18GFWKK46 pKa = 8.44GWKK49 pKa = 8.41MALNRR54 pKa = 11.84LGRR57 pKa = 11.84CKK59 pKa = 10.52YY60 pKa = 10.14PNGGEE65 pKa = 4.08DD66 pKa = 3.73LPP68 pKa = 5.5
MM1 pKa = 7.77LINVSIKK8 pKa = 10.38LIKK11 pKa = 10.12LYY13 pKa = 10.59QRR15 pKa = 11.84LAPQKK20 pKa = 10.41IRR22 pKa = 11.84DD23 pKa = 3.55ACRR26 pKa = 11.84FEE28 pKa = 4.46PTCSNYY34 pKa = 10.73AILALQKK41 pKa = 10.32YY42 pKa = 7.18GFWKK46 pKa = 8.44GWKK49 pKa = 8.41MALNRR54 pKa = 11.84LGRR57 pKa = 11.84CKK59 pKa = 10.52YY60 pKa = 10.14PNGGEE65 pKa = 4.08DD66 pKa = 3.73LPP68 pKa = 5.5
Molecular weight: 7.9 kDa
Isoelectric point according different methods:
Peptides (in silico digests for buttom-up proteomics)
Below you can find in silico digests of the whole proteome with Trypsin, Chymotrypsin, Trypsin+LysC, LysN, ArgC proteases suitable for different mass spec machines.| Try ESI |
 |
|---|
| ChTry ESI |
 |
|---|
| ArgC ESI |
 |
|---|
| LysN ESI |
 |
|---|
| TryLysC ESI |
 |
|---|
| Try MALDI |
 |
|---|
| ChTry MALDI |
 |
|---|
| ArgC MALDI |
 |
|---|
| LysN MALDI |
 |
|---|
| TryLysC MALDI |
 |
|---|
| Try LTQ |
 |
|---|
| ChTry LTQ |
 |
|---|
| ArgC LTQ |
 |
|---|
| LysN LTQ |
 |
|---|
| TryLysC LTQ |
 |
|---|
| Try MSlow |
 |
|---|
| ChTry MSlow |
 |
|---|
| ArgC MSlow |
 |
|---|
| LysN MSlow |
 |
|---|
| TryLysC MSlow |
 |
|---|
| Try MShigh |
 |
|---|
| ChTry MShigh |
 |
|---|
| ArgC MShigh |
 |
|---|
| LysN MShigh |
 |
|---|
| TryLysC MShigh |
 |
|---|
General Statistics
Number of major isoforms |
Number of additional isoforms |
Number of all proteins |
Number of amino acids |
Min. Seq. Length |
Max. Seq. Length |
Avg. Seq. Length |
Avg. Mol. Weight |
|---|---|---|---|---|---|---|---|
0 |
9882 |
61 |
925 |
241.0 |
27.18 |
Amino acid frequency
Ala |
Cys |
Asp |
Glu |
Phe |
Gly |
His |
Ile |
Lys |
Leu |
|---|---|---|---|---|---|---|---|---|---|
8.085 ± 0.422 | 0.901 ± 0.134 |
5.505 ± 0.216 | 6.831 ± 0.429 |
4.382 ± 0.193 | 6.234 ± 0.462 |
1.923 ± 0.166 | 6.426 ± 0.275 |
7.772 ± 0.363 | 8.885 ± 0.362 |
Met |
Asn |
Gln |
Pro |
Arg |
Ser |
Thr |
Val |
Trp |
Tyr |
|---|---|---|---|---|---|---|---|---|---|
2.206 ± 0.179 | 5.839 ± 0.322 |
3.177 ± 0.203 | 4.685 ± 0.255 |
4.655 ± 0.353 | 6.173 ± 0.237 |
5.606 ± 0.311 | 5.97 ± 0.24 |
1.305 ± 0.116 | 3.441 ± 0.229 |
Most of the basic statistics you can see at this page can be downloaded from this CSV file
Proteome-pI is available under Creative Commons Attribution-NoDerivs license, for more details see here
| Reference: Kozlowski LP. Proteome-pI 2.0: Proteome Isoelectric Point Database Update. Nucleic Acids Res. 2021, doi: 10.1093/nar/gkab944 | Contact: Lukasz P. Kozlowski |
