Massilimicrobiota sp. An134
Taxonomy: cellular organisms; Bacteria; Terrabacteria group; Firmicutes; Erysipelotrichia; Erysipelotrichales; Erysipelotrichaceae; Massilimicrobiota; unclassified Massilimicrobiota
Average proteome isoelectric point is 6.16
Get precalculated fractions of proteins

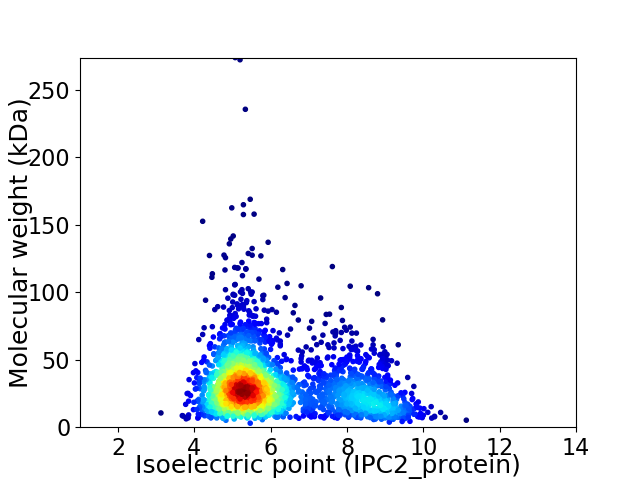
Virtual 2D-PAGE plot for 2537 proteins (isoelectric point calculated using IPC2_protein)
Get csv file with sequences according to given criteria:
* You can choose from 21 different methods for calculating isoelectric point
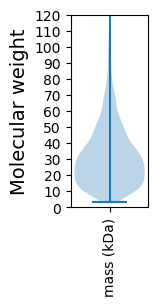
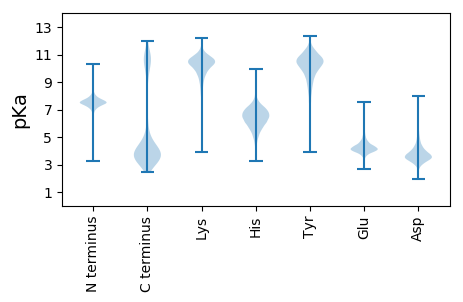
Summary statistics related to proteome-wise predictions


Protein with the lowest isoelectric point:
>tr|A0A1Y4S6Q7|A0A1Y4S6Q7_9FIRM Bacitracin ABC transporter ATP-binding protein OS=Massilimicrobiota sp. An134 OX=1965557 GN=B5E79_11915 PE=4 SV=1
MM1 pKa = 7.54KK2 pKa = 10.19KK3 pKa = 9.88IKK5 pKa = 10.38CLLFVFCVCLLSACQSNDD23 pKa = 2.74NVSKK27 pKa = 11.11VNEE30 pKa = 4.08QQSVSVPNEE39 pKa = 4.16TISSDD44 pKa = 3.28GKK46 pKa = 10.59ILIAYY51 pKa = 7.36FTWADD56 pKa = 3.55NTHH59 pKa = 5.99VDD61 pKa = 4.24DD62 pKa = 5.09PSSVDD67 pKa = 3.15VDD69 pKa = 3.61ASTSASVLAPGNTEE83 pKa = 3.8KK84 pKa = 10.72VAHH87 pKa = 7.01FIQEE91 pKa = 4.15QVGGDD96 pKa = 3.59MFSIIVDD103 pKa = 3.62EE104 pKa = 5.38PYY106 pKa = 10.91SSDD109 pKa = 3.45YY110 pKa = 11.41DD111 pKa = 3.61EE112 pKa = 5.44CLDD115 pKa = 4.07RR116 pKa = 11.84ASDD119 pKa = 3.83EE120 pKa = 4.36PAQQARR126 pKa = 11.84PIIVDD131 pKa = 3.37TVEE134 pKa = 5.14NMDD137 pKa = 3.76EE138 pKa = 4.2YY139 pKa = 11.69DD140 pKa = 4.25VIFLGYY146 pKa = 8.36PNWWSSCPMAIFSFIEE162 pKa = 4.6SYY164 pKa = 11.11DD165 pKa = 3.78LSNKK169 pKa = 9.24TIIPFCAHH177 pKa = 5.41GTGGLGRR184 pKa = 11.84SIEE187 pKa = 4.3DD188 pKa = 3.49LQDD191 pKa = 3.96ALPHH195 pKa = 5.64STLLDD200 pKa = 3.41AFGVYY205 pKa = 9.98RR206 pKa = 11.84PDD208 pKa = 3.42TDD210 pKa = 3.6SCQDD214 pKa = 5.12DD215 pKa = 4.01VNQWLSDD222 pKa = 3.0IGMVDD227 pKa = 3.08
MM1 pKa = 7.54KK2 pKa = 10.19KK3 pKa = 9.88IKK5 pKa = 10.38CLLFVFCVCLLSACQSNDD23 pKa = 2.74NVSKK27 pKa = 11.11VNEE30 pKa = 4.08QQSVSVPNEE39 pKa = 4.16TISSDD44 pKa = 3.28GKK46 pKa = 10.59ILIAYY51 pKa = 7.36FTWADD56 pKa = 3.55NTHH59 pKa = 5.99VDD61 pKa = 4.24DD62 pKa = 5.09PSSVDD67 pKa = 3.15VDD69 pKa = 3.61ASTSASVLAPGNTEE83 pKa = 3.8KK84 pKa = 10.72VAHH87 pKa = 7.01FIQEE91 pKa = 4.15QVGGDD96 pKa = 3.59MFSIIVDD103 pKa = 3.62EE104 pKa = 5.38PYY106 pKa = 10.91SSDD109 pKa = 3.45YY110 pKa = 11.41DD111 pKa = 3.61EE112 pKa = 5.44CLDD115 pKa = 4.07RR116 pKa = 11.84ASDD119 pKa = 3.83EE120 pKa = 4.36PAQQARR126 pKa = 11.84PIIVDD131 pKa = 3.37TVEE134 pKa = 5.14NMDD137 pKa = 3.76EE138 pKa = 4.2YY139 pKa = 11.69DD140 pKa = 4.25VIFLGYY146 pKa = 8.36PNWWSSCPMAIFSFIEE162 pKa = 4.6SYY164 pKa = 11.11DD165 pKa = 3.78LSNKK169 pKa = 9.24TIIPFCAHH177 pKa = 5.41GTGGLGRR184 pKa = 11.84SIEE187 pKa = 4.3DD188 pKa = 3.49LQDD191 pKa = 3.96ALPHH195 pKa = 5.64STLLDD200 pKa = 3.41AFGVYY205 pKa = 9.98RR206 pKa = 11.84PDD208 pKa = 3.42TDD210 pKa = 3.6SCQDD214 pKa = 5.12DD215 pKa = 4.01VNQWLSDD222 pKa = 3.0IGMVDD227 pKa = 3.08
Molecular weight: 25.03 kDa
Isoelectric point according different methods:
Protein with the highest isoelectric point:
>tr|A0A1Y4SJ66|A0A1Y4SJ66_9FIRM Cysteine--tRNA ligase OS=Massilimicrobiota sp. An134 OX=1965557 GN=cysS PE=3 SV=1
MM1 pKa = 7.35KK2 pKa = 9.42RR3 pKa = 11.84TYY5 pKa = 10.34QPNKK9 pKa = 8.51RR10 pKa = 11.84KK11 pKa = 9.77RR12 pKa = 11.84SKK14 pKa = 8.62THH16 pKa = 5.5GFRR19 pKa = 11.84ARR21 pKa = 11.84MATVGGRR28 pKa = 11.84KK29 pKa = 9.08VLARR33 pKa = 11.84RR34 pKa = 11.84RR35 pKa = 11.84KK36 pKa = 9.02RR37 pKa = 11.84GRR39 pKa = 11.84KK40 pKa = 8.93VLSAA44 pKa = 4.11
MM1 pKa = 7.35KK2 pKa = 9.42RR3 pKa = 11.84TYY5 pKa = 10.34QPNKK9 pKa = 8.51RR10 pKa = 11.84KK11 pKa = 9.77RR12 pKa = 11.84SKK14 pKa = 8.62THH16 pKa = 5.5GFRR19 pKa = 11.84ARR21 pKa = 11.84MATVGGRR28 pKa = 11.84KK29 pKa = 9.08VLARR33 pKa = 11.84RR34 pKa = 11.84RR35 pKa = 11.84KK36 pKa = 9.02RR37 pKa = 11.84GRR39 pKa = 11.84KK40 pKa = 8.93VLSAA44 pKa = 4.11
Molecular weight: 5.2 kDa
Isoelectric point according different methods:
Peptides (in silico digests for buttom-up proteomics)
Below you can find in silico digests of the whole proteome with Trypsin, Chymotrypsin, Trypsin+LysC, LysN, ArgC proteases suitable for different mass spec machines.| Try ESI |
 |
|---|
| ChTry ESI |
 |
|---|
| ArgC ESI |
 |
|---|
| LysN ESI |
 |
|---|
| TryLysC ESI |
 |
|---|
| Try MALDI |
 |
|---|
| ChTry MALDI |
 |
|---|
| ArgC MALDI |
 |
|---|
| LysN MALDI |
 |
|---|
| TryLysC MALDI |
 |
|---|
| Try LTQ |
 |
|---|
| ChTry LTQ |
 |
|---|
| ArgC LTQ |
 |
|---|
| LysN LTQ |
 |
|---|
| TryLysC LTQ |
 |
|---|
| Try MSlow |
 |
|---|
| ChTry MSlow |
 |
|---|
| ArgC MSlow |
 |
|---|
| LysN MSlow |
 |
|---|
| TryLysC MSlow |
 |
|---|
| Try MShigh |
 |
|---|
| ChTry MShigh |
 |
|---|
| ArgC MShigh |
 |
|---|
| LysN MShigh |
 |
|---|
| TryLysC MShigh |
 |
|---|
General Statistics
Number of major isoforms |
Number of additional isoforms |
Number of all proteins |
Number of amino acids |
Min. Seq. Length |
Max. Seq. Length |
Avg. Seq. Length |
Avg. Mol. Weight |
|---|---|---|---|---|---|---|---|
0 |
746771 |
27 |
2433 |
294.4 |
33.61 |
Amino acid frequency
Ala |
Cys |
Asp |
Glu |
Phe |
Gly |
His |
Ile |
Lys |
Leu |
|---|---|---|---|---|---|---|---|---|---|
5.571 ± 0.054 | 1.418 ± 0.021 |
6.06 ± 0.037 | 6.749 ± 0.043 |
4.447 ± 0.041 | 5.85 ± 0.054 |
2.618 ± 0.033 | 8.887 ± 0.058 |
7.422 ± 0.044 | 9.382 ± 0.053 |
Met |
Asn |
Gln |
Pro |
Arg |
Ser |
Thr |
Val |
Trp |
Tyr |
|---|---|---|---|---|---|---|---|---|---|
3.104 ± 0.025 | 4.812 ± 0.041 |
2.917 ± 0.024 | 4.516 ± 0.044 |
3.427 ± 0.033 | 5.798 ± 0.034 |
5.023 ± 0.047 | 6.315 ± 0.046 |
0.729 ± 0.014 | 4.953 ± 0.042 |
Most of the basic statistics you can see at this page can be downloaded from this CSV file
Proteome-pI is available under Creative Commons Attribution-NoDerivs license, for more details see here
| Reference: Kozlowski LP. Proteome-pI 2.0: Proteome Isoelectric Point Database Update. Nucleic Acids Res. 2021, doi: 10.1093/nar/gkab944 | Contact: Lukasz P. Kozlowski |
