Pleurochrysis carterae circular virus
Taxonomy: Viruses; Monodnaviria; Shotokuvirae; Cressdnaviricota; Arfiviricetes; Cirlivirales; Circoviridae; unclassified Circoviridae
Average proteome isoelectric point is 8.3
Get precalculated fractions of proteins

Virtual 2D-PAGE plot for 3 proteins (isoelectric point calculated using IPC2_protein)
Get csv file with sequences according to given criteria:
* You can choose from 21 different methods for calculating isoelectric point
Summary statistics related to proteome-wise predictions


Protein with the lowest isoelectric point:
>tr|A0A2H4YB72|A0A2H4YB72_9CIRC ATP-dependent helicase Rep OS=Pleurochrysis carterae circular virus OX=2057942 GN=rep PE=3 SV=1
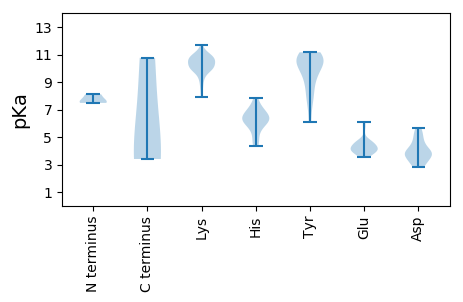
MM1 pKa = 8.11DD2 pKa = 4.22NTLEE6 pKa = 4.14MQAFAHH12 pKa = 7.08ASDD15 pKa = 3.6TQTKK19 pKa = 9.81KK20 pKa = 10.47FRR22 pKa = 11.84NFVFTKK28 pKa = 10.59NNYY31 pKa = 8.0SQEE34 pKa = 4.16DD35 pKa = 4.19LDD37 pKa = 5.66DD38 pKa = 5.1LDD40 pKa = 4.59SMEE43 pKa = 4.65IKK45 pKa = 10.65YY46 pKa = 10.49LIYY49 pKa = 10.41GKK51 pKa = 10.41EE52 pKa = 4.07SAPTTGTPHH61 pKa = 6.13LQGFVVFKK69 pKa = 9.93NQRR72 pKa = 11.84STGSVCKK79 pKa = 9.91EE80 pKa = 3.84LKK82 pKa = 10.08CWARR86 pKa = 11.84PAKK89 pKa = 7.94TTQCAIAYY97 pKa = 7.2CKK99 pKa = 10.25KK100 pKa = 10.74DD101 pKa = 2.84GDD103 pKa = 3.96FVEE106 pKa = 5.67RR107 pKa = 11.84GTPPMTQEE115 pKa = 3.71EE116 pKa = 4.68CGKK119 pKa = 10.37KK120 pKa = 10.59GEE122 pKa = 4.08EE123 pKa = 4.58FYY125 pKa = 11.09FKK127 pKa = 10.64CLTAAEE133 pKa = 4.3EE134 pKa = 4.75GRR136 pKa = 11.84FEE138 pKa = 6.09DD139 pKa = 3.79IPASIMFTQDD149 pKa = 2.9QAIHH153 pKa = 6.04RR154 pKa = 11.84HH155 pKa = 4.61RR156 pKa = 11.84QRR158 pKa = 11.84ALLARR163 pKa = 11.84EE164 pKa = 4.45LKK166 pKa = 10.02DD167 pKa = 3.33TDD169 pKa = 4.52EE170 pKa = 4.14QMLWYY175 pKa = 9.22WGAPGTGKK183 pKa = 10.21SKK185 pKa = 10.54KK186 pKa = 10.19ARR188 pKa = 11.84GDD190 pKa = 3.33HH191 pKa = 6.37PGFYY195 pKa = 10.88LKK197 pKa = 9.63MCNKK201 pKa = 8.7WWDD204 pKa = 4.0GYY206 pKa = 11.16SDD208 pKa = 3.73QEE210 pKa = 4.3VAILEE215 pKa = 4.65DD216 pKa = 3.9FDD218 pKa = 5.25KK219 pKa = 10.77KK220 pKa = 10.45HH221 pKa = 6.1EE222 pKa = 4.17MLGHH226 pKa = 6.45HH227 pKa = 6.51LKK229 pKa = 9.98IWGDD233 pKa = 3.87RR234 pKa = 11.84YY235 pKa = 10.36PFPAEE240 pKa = 3.7IKK242 pKa = 9.91GGAMVIRR249 pKa = 11.84PKK251 pKa = 10.86LVIVTSNWHH260 pKa = 6.64PSDD263 pKa = 2.83IWSDD267 pKa = 3.54KK268 pKa = 9.17PTLDD272 pKa = 4.62PILRR276 pKa = 11.84RR277 pKa = 11.84FKK279 pKa = 10.8CIEE282 pKa = 4.01FKK284 pKa = 10.88ALNVGSSSQNTAAPTAQNTLSQFDD308 pKa = 3.92DD309 pKa = 3.65
MM1 pKa = 8.11DD2 pKa = 4.22NTLEE6 pKa = 4.14MQAFAHH12 pKa = 7.08ASDD15 pKa = 3.6TQTKK19 pKa = 9.81KK20 pKa = 10.47FRR22 pKa = 11.84NFVFTKK28 pKa = 10.59NNYY31 pKa = 8.0SQEE34 pKa = 4.16DD35 pKa = 4.19LDD37 pKa = 5.66DD38 pKa = 5.1LDD40 pKa = 4.59SMEE43 pKa = 4.65IKK45 pKa = 10.65YY46 pKa = 10.49LIYY49 pKa = 10.41GKK51 pKa = 10.41EE52 pKa = 4.07SAPTTGTPHH61 pKa = 6.13LQGFVVFKK69 pKa = 9.93NQRR72 pKa = 11.84STGSVCKK79 pKa = 9.91EE80 pKa = 3.84LKK82 pKa = 10.08CWARR86 pKa = 11.84PAKK89 pKa = 7.94TTQCAIAYY97 pKa = 7.2CKK99 pKa = 10.25KK100 pKa = 10.74DD101 pKa = 2.84GDD103 pKa = 3.96FVEE106 pKa = 5.67RR107 pKa = 11.84GTPPMTQEE115 pKa = 3.71EE116 pKa = 4.68CGKK119 pKa = 10.37KK120 pKa = 10.59GEE122 pKa = 4.08EE123 pKa = 4.58FYY125 pKa = 11.09FKK127 pKa = 10.64CLTAAEE133 pKa = 4.3EE134 pKa = 4.75GRR136 pKa = 11.84FEE138 pKa = 6.09DD139 pKa = 3.79IPASIMFTQDD149 pKa = 2.9QAIHH153 pKa = 6.04RR154 pKa = 11.84HH155 pKa = 4.61RR156 pKa = 11.84QRR158 pKa = 11.84ALLARR163 pKa = 11.84EE164 pKa = 4.45LKK166 pKa = 10.02DD167 pKa = 3.33TDD169 pKa = 4.52EE170 pKa = 4.14QMLWYY175 pKa = 9.22WGAPGTGKK183 pKa = 10.21SKK185 pKa = 10.54KK186 pKa = 10.19ARR188 pKa = 11.84GDD190 pKa = 3.33HH191 pKa = 6.37PGFYY195 pKa = 10.88LKK197 pKa = 9.63MCNKK201 pKa = 8.7WWDD204 pKa = 4.0GYY206 pKa = 11.16SDD208 pKa = 3.73QEE210 pKa = 4.3VAILEE215 pKa = 4.65DD216 pKa = 3.9FDD218 pKa = 5.25KK219 pKa = 10.77KK220 pKa = 10.45HH221 pKa = 6.1EE222 pKa = 4.17MLGHH226 pKa = 6.45HH227 pKa = 6.51LKK229 pKa = 9.98IWGDD233 pKa = 3.87RR234 pKa = 11.84YY235 pKa = 10.36PFPAEE240 pKa = 3.7IKK242 pKa = 9.91GGAMVIRR249 pKa = 11.84PKK251 pKa = 10.86LVIVTSNWHH260 pKa = 6.64PSDD263 pKa = 2.83IWSDD267 pKa = 3.54KK268 pKa = 9.17PTLDD272 pKa = 4.62PILRR276 pKa = 11.84RR277 pKa = 11.84FKK279 pKa = 10.8CIEE282 pKa = 4.01FKK284 pKa = 10.88ALNVGSSSQNTAAPTAQNTLSQFDD308 pKa = 3.92DD309 pKa = 3.65
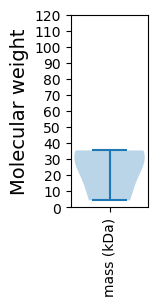
Molecular weight: 35.37 kDa
Isoelectric point according different methods:
Protein with the highest isoelectric point:
>tr|A0A2H4YB64|A0A2H4YB64_9CIRC Capsid protein OS=Pleurochrysis carterae circular virus OX=2057942 PE=4 SV=1
MM1 pKa = 7.48LSSRR5 pKa = 11.84MARR8 pKa = 11.84AVCEE12 pKa = 3.93RR13 pKa = 11.84LKK15 pKa = 11.01KK16 pKa = 10.27SASLSTSDD24 pKa = 5.2YY25 pKa = 10.94LWQTQVRR32 pKa = 11.84PPVLKK37 pKa = 10.76
MM1 pKa = 7.48LSSRR5 pKa = 11.84MARR8 pKa = 11.84AVCEE12 pKa = 3.93RR13 pKa = 11.84LKK15 pKa = 11.01KK16 pKa = 10.27SASLSTSDD24 pKa = 5.2YY25 pKa = 10.94LWQTQVRR32 pKa = 11.84PPVLKK37 pKa = 10.76
Molecular weight: 4.24 kDa
Isoelectric point according different methods:
Peptides (in silico digests for buttom-up proteomics)
Below you can find in silico digests of the whole proteome with Trypsin, Chymotrypsin, Trypsin+LysC, LysN, ArgC proteases suitable for different mass spec machines.| Try ESI |
 |
|---|
| ChTry ESI |
 |
|---|
| ArgC ESI |
 |
|---|
| LysN ESI |
 |
|---|
| TryLysC ESI |
 |
|---|
| Try MALDI |
 |
|---|
| ChTry MALDI |
 |
|---|
| ArgC MALDI |
 |
|---|
| LysN MALDI |
 |
|---|
| TryLysC MALDI |
 |
|---|
| Try LTQ |
 |
|---|
| ChTry LTQ |
 |
|---|
| ArgC LTQ |
 |
|---|
| LysN LTQ |
 |
|---|
| TryLysC LTQ |
 |
|---|
| Try MSlow |
 |
|---|
| ChTry MSlow |
 |
|---|
| ArgC MSlow |
 |
|---|
| LysN MSlow |
 |
|---|
| TryLysC MSlow |
 |
|---|
| Try MShigh |
 |
|---|
| ChTry MShigh |
 |
|---|
| ArgC MShigh |
 |
|---|
| LysN MShigh |
 |
|---|
| TryLysC MShigh |
 |
|---|
General Statistics
Number of major isoforms |
Number of additional isoforms |
Number of all proteins |
Number of amino acids |
Min. Seq. Length |
Max. Seq. Length |
Avg. Seq. Length |
Avg. Mol. Weight |
|---|---|---|---|---|---|---|---|
0 |
620 |
37 |
309 |
206.7 |
23.4 |
Amino acid frequency
Ala |
Cys |
Asp |
Glu |
Phe |
Gly |
His |
Ile |
Lys |
Leu |
|---|---|---|---|---|---|---|---|---|---|
7.742 ± 0.202 | 2.097 ± 0.369 |
5.484 ± 1.336 | 4.516 ± 1.322 |
4.355 ± 0.939 | 6.129 ± 0.944 |
2.903 ± 0.453 | 4.194 ± 0.653 |
8.065 ± 0.687 | 5.806 ± 1.37 |
Met |
Asn |
Gln |
Pro |
Arg |
Ser |
Thr |
Val |
Trp |
Tyr |
|---|---|---|---|---|---|---|---|---|---|
2.742 ± 0.454 | 3.226 ± 0.504 |
5.0 ± 0.108 | 3.71 ± 0.878 |
6.774 ± 1.553 | 7.742 ± 1.995 |
8.065 ± 1.036 | 5.645 ± 1.629 |
1.613 ± 0.724 | 4.194 ± 0.954 |
Most of the basic statistics you can see at this page can be downloaded from this CSV file
Proteome-pI is available under Creative Commons Attribution-NoDerivs license, for more details see here
| Reference: Kozlowski LP. Proteome-pI 2.0: Proteome Isoelectric Point Database Update. Nucleic Acids Res. 2021, doi: 10.1093/nar/gkab944 | Contact: Lukasz P. Kozlowski |
