Tortoise microvirus 56
Taxonomy: Viruses; Monodnaviria; Sangervirae; Phixviricota; Malgrandaviricetes; Petitvirales; Microviridae; unclassified Microviridae
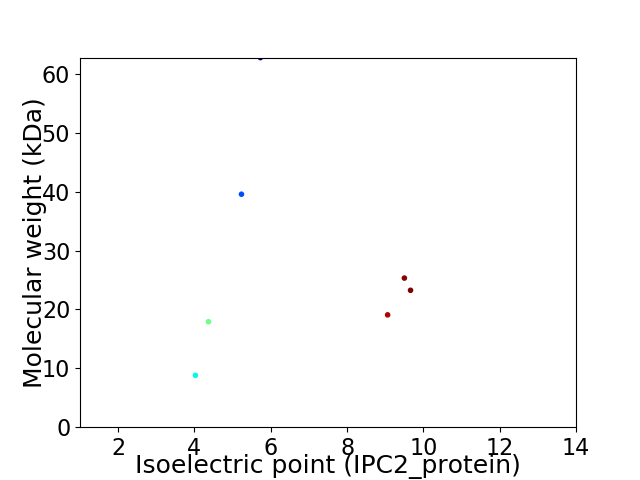
Average proteome isoelectric point is 6.64
Get precalculated fractions of proteins

Virtual 2D-PAGE plot for 7 proteins (isoelectric point calculated using IPC2_protein)
Get csv file with sequences according to given criteria:
* You can choose from 21 different methods for calculating isoelectric point
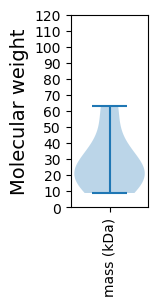
Summary statistics related to proteome-wise predictions


Protein with the lowest isoelectric point:
>tr|A0A4P8W9Y2|A0A4P8W9Y2_9VIRU Uncharacterized protein OS=Tortoise microvirus 56 OX=2583161 PE=4 SV=1
MM1 pKa = 7.68LSLEE5 pKa = 4.12LSSWNIDD12 pKa = 3.33LDD14 pKa = 4.02CFYY17 pKa = 11.21DD18 pKa = 4.91DD19 pKa = 4.63EE20 pKa = 6.26GLLFDD25 pKa = 3.75YY26 pKa = 10.83YY27 pKa = 11.08KK28 pKa = 11.03YY29 pKa = 10.53RR30 pKa = 11.84DD31 pKa = 3.99YY32 pKa = 10.15EE33 pKa = 4.07TAMQQQSFFKK43 pKa = 10.22SYY45 pKa = 11.14SDD47 pKa = 4.95AVLDD51 pKa = 5.19DD52 pKa = 4.57NMLFDD57 pKa = 6.36KK58 pKa = 10.45IRR60 pKa = 11.84KK61 pKa = 8.28RR62 pKa = 11.84NEE64 pKa = 3.35VEE66 pKa = 4.99LFSEE70 pKa = 5.64CYY72 pKa = 9.98
MM1 pKa = 7.68LSLEE5 pKa = 4.12LSSWNIDD12 pKa = 3.33LDD14 pKa = 4.02CFYY17 pKa = 11.21DD18 pKa = 4.91DD19 pKa = 4.63EE20 pKa = 6.26GLLFDD25 pKa = 3.75YY26 pKa = 10.83YY27 pKa = 11.08KK28 pKa = 11.03YY29 pKa = 10.53RR30 pKa = 11.84DD31 pKa = 3.99YY32 pKa = 10.15EE33 pKa = 4.07TAMQQQSFFKK43 pKa = 10.22SYY45 pKa = 11.14SDD47 pKa = 4.95AVLDD51 pKa = 5.19DD52 pKa = 4.57NMLFDD57 pKa = 6.36KK58 pKa = 10.45IRR60 pKa = 11.84KK61 pKa = 8.28RR62 pKa = 11.84NEE64 pKa = 3.35VEE66 pKa = 4.99LFSEE70 pKa = 5.64CYY72 pKa = 9.98
Molecular weight: 8.82 kDa
Isoelectric point according different methods:
Protein with the highest isoelectric point:
>tr|A0A4P8W6E5|A0A4P8W6E5_9VIRU Uncharacterized protein OS=Tortoise microvirus 56 OX=2583161 PE=4 SV=1
MM1 pKa = 7.64LLHH4 pKa = 6.67SGLVISILIVIKK16 pKa = 9.74QQSFIIIEE24 pKa = 4.29TVEE27 pKa = 3.93VNIPAGEE34 pKa = 4.52FKK36 pKa = 10.6RR37 pKa = 11.84QQSYY41 pKa = 10.17SVTRR45 pKa = 11.84KK46 pKa = 9.09VMYY49 pKa = 10.15IKK51 pKa = 10.58RR52 pKa = 11.84QGSQKK57 pKa = 9.88FRR59 pKa = 11.84VEE61 pKa = 3.84INEE64 pKa = 4.84LIHH67 pKa = 7.85IRR69 pKa = 11.84DD70 pKa = 3.89FKK72 pKa = 9.6TVKK75 pKa = 10.08IVDD78 pKa = 4.78EE79 pKa = 4.35IRR81 pKa = 11.84LTPNTLRR88 pKa = 11.84TTNYY92 pKa = 9.41INLFIQFHH100 pKa = 5.57IVIRR104 pKa = 11.84MHH106 pKa = 7.04VIINTKK112 pKa = 10.15KK113 pKa = 10.47NSTAQQCTRR122 pKa = 11.84LRR124 pKa = 11.84YY125 pKa = 9.76AEE127 pKa = 3.92QSLLKK132 pKa = 10.27SQQTLYY138 pKa = 11.36VLIGTVRR145 pKa = 11.84IVAYY149 pKa = 10.28LIEE152 pKa = 4.3QMITSYY158 pKa = 11.31NGLNIVRR165 pKa = 11.84DD166 pKa = 3.39IRR168 pKa = 11.84KK169 pKa = 9.71NIIIRR174 pKa = 11.84NVIRR178 pKa = 11.84KK179 pKa = 9.37GYY181 pKa = 7.67STEE184 pKa = 4.05FNEE187 pKa = 5.79LRR189 pKa = 11.84QDD191 pKa = 3.01WVKK194 pKa = 10.64FIII197 pKa = 4.47
MM1 pKa = 7.64LLHH4 pKa = 6.67SGLVISILIVIKK16 pKa = 9.74QQSFIIIEE24 pKa = 4.29TVEE27 pKa = 3.93VNIPAGEE34 pKa = 4.52FKK36 pKa = 10.6RR37 pKa = 11.84QQSYY41 pKa = 10.17SVTRR45 pKa = 11.84KK46 pKa = 9.09VMYY49 pKa = 10.15IKK51 pKa = 10.58RR52 pKa = 11.84QGSQKK57 pKa = 9.88FRR59 pKa = 11.84VEE61 pKa = 3.84INEE64 pKa = 4.84LIHH67 pKa = 7.85IRR69 pKa = 11.84DD70 pKa = 3.89FKK72 pKa = 9.6TVKK75 pKa = 10.08IVDD78 pKa = 4.78EE79 pKa = 4.35IRR81 pKa = 11.84LTPNTLRR88 pKa = 11.84TTNYY92 pKa = 9.41INLFIQFHH100 pKa = 5.57IVIRR104 pKa = 11.84MHH106 pKa = 7.04VIINTKK112 pKa = 10.15KK113 pKa = 10.47NSTAQQCTRR122 pKa = 11.84LRR124 pKa = 11.84YY125 pKa = 9.76AEE127 pKa = 3.92QSLLKK132 pKa = 10.27SQQTLYY138 pKa = 11.36VLIGTVRR145 pKa = 11.84IVAYY149 pKa = 10.28LIEE152 pKa = 4.3QMITSYY158 pKa = 11.31NGLNIVRR165 pKa = 11.84DD166 pKa = 3.39IRR168 pKa = 11.84KK169 pKa = 9.71NIIIRR174 pKa = 11.84NVIRR178 pKa = 11.84KK179 pKa = 9.37GYY181 pKa = 7.67STEE184 pKa = 4.05FNEE187 pKa = 5.79LRR189 pKa = 11.84QDD191 pKa = 3.01WVKK194 pKa = 10.64FIII197 pKa = 4.47
Molecular weight: 23.25 kDa
Isoelectric point according different methods:
Peptides (in silico digests for buttom-up proteomics)
Below you can find in silico digests of the whole proteome with Trypsin, Chymotrypsin, Trypsin+LysC, LysN, ArgC proteases suitable for different mass spec machines.| Try ESI |
 |
|---|
| ChTry ESI |
 |
|---|
| ArgC ESI |
 |
|---|
| LysN ESI |
 |
|---|
| TryLysC ESI |
 |
|---|
| Try MALDI |
 |
|---|
| ChTry MALDI |
 |
|---|
| ArgC MALDI |
 |
|---|
| LysN MALDI |
 |
|---|
| TryLysC MALDI |
 |
|---|
| Try LTQ |
 |
|---|
| ChTry LTQ |
 |
|---|
| ArgC LTQ |
 |
|---|
| LysN LTQ |
 |
|---|
| TryLysC LTQ |
 |
|---|
| Try MSlow |
 |
|---|
| ChTry MSlow |
 |
|---|
| ArgC MSlow |
 |
|---|
| LysN MSlow |
 |
|---|
| TryLysC MSlow |
 |
|---|
| Try MShigh |
 |
|---|
| ChTry MShigh |
 |
|---|
| ArgC MShigh |
 |
|---|
| LysN MShigh |
 |
|---|
| TryLysC MShigh |
 |
|---|
General Statistics
Number of major isoforms |
Number of additional isoforms |
Number of all proteins |
Number of amino acids |
Min. Seq. Length |
Max. Seq. Length |
Avg. Seq. Length |
Avg. Mol. Weight |
|---|---|---|---|---|---|---|---|
0 |
1716 |
72 |
561 |
245.1 |
28.11 |
Amino acid frequency
Ala |
Cys |
Asp |
Glu |
Phe |
Gly |
His |
Ile |
Lys |
Leu |
|---|---|---|---|---|---|---|---|---|---|
5.128 ± 0.873 | 1.515 ± 0.622 |
5.245 ± 1.038 | 4.254 ± 0.97 |
5.594 ± 1.392 | 4.487 ± 1.324 |
1.632 ± 0.402 | 7.576 ± 1.53 |
4.021 ± 0.48 | 9.79 ± 2.064 |
Met |
Asn |
Gln |
Pro |
Arg |
Ser |
Thr |
Val |
Trp |
Tyr |
|---|---|---|---|---|---|---|---|---|---|
2.681 ± 0.33 | 5.886 ± 1.036 |
3.497 ± 0.76 | 4.837 ± 1.398 |
5.769 ± 0.665 | 8.974 ± 0.798 |
5.944 ± 0.742 | 6.76 ± 0.772 |
0.816 ± 0.188 | 5.594 ± 1.223 |
Most of the basic statistics you can see at this page can be downloaded from this CSV file
Proteome-pI is available under Creative Commons Attribution-NoDerivs license, for more details see here
| Reference: Kozlowski LP. Proteome-pI 2.0: Proteome Isoelectric Point Database Update. Nucleic Acids Res. 2021, doi: 10.1093/nar/gkab944 | Contact: Lukasz P. Kozlowski |
