Free State vervet virus
Taxonomy: Viruses; Riboviria; Orthornavirae; Pisuviricota; Pisoniviricetes; Nidovirales; Arnidovirineae; Arteriviridae; Simarterivirinae; Epsilonarterivirus; Sheartevirus; Epsilonarterivirus safriver
Average proteome isoelectric point is 7.63
Get precalculated fractions of proteins

Virtual 2D-PAGE plot for 14 proteins (isoelectric point calculated using IPC2_protein)
Get csv file with sequences according to given criteria:
* You can choose from 21 different methods for calculating isoelectric point
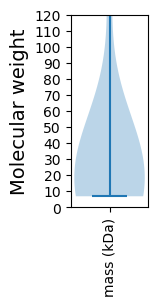
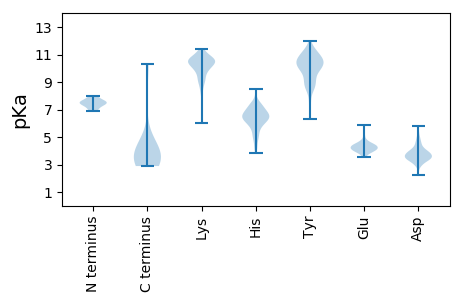
Summary statistics related to proteome-wise predictions


Protein with the lowest isoelectric point:
>tr|A0A161D4J7|A0A161D4J7_9NIDO ORF3' protein OS=Free State vervet virus OX=1737586 PE=4 SV=1
MM1 pKa = 6.86VSSWLLHH8 pKa = 6.21ACLSCFFFQCMHH20 pKa = 6.94CSNNNGTNTTDD31 pKa = 3.4QISVPTCFSFPRR43 pKa = 11.84ANFSVHH49 pKa = 5.55LHH51 pKa = 6.15FEE53 pKa = 4.14ALVCRR58 pKa = 11.84TDD60 pKa = 3.51PGTLAPGYY68 pKa = 8.61ITASKK73 pKa = 9.75GGCSSVSSGSGYY85 pKa = 11.0AVDD88 pKa = 4.86RR89 pKa = 11.84KK90 pKa = 10.34LIQYY94 pKa = 7.04PHH96 pKa = 7.29NITADD101 pKa = 3.29FDD103 pKa = 5.01LNNTLDD109 pKa = 3.33QSHH112 pKa = 6.24AHH114 pKa = 6.34LAALLTAVLLYY125 pKa = 10.75DD126 pKa = 4.12PEE128 pKa = 4.85SFGLDD133 pKa = 3.49PNKK136 pKa = 10.43SRR138 pKa = 11.84SFNVSSTDD146 pKa = 3.08ANYY149 pKa = 8.65TFCVNGTVSLPNTTLGSYY167 pKa = 10.5YY168 pKa = 10.37FFNSSTWDD176 pKa = 3.61LYY178 pKa = 10.76VLEE181 pKa = 4.56LFRR184 pKa = 11.84PFVLSLLVLSIAFAA198 pKa = 4.32
MM1 pKa = 6.86VSSWLLHH8 pKa = 6.21ACLSCFFFQCMHH20 pKa = 6.94CSNNNGTNTTDD31 pKa = 3.4QISVPTCFSFPRR43 pKa = 11.84ANFSVHH49 pKa = 5.55LHH51 pKa = 6.15FEE53 pKa = 4.14ALVCRR58 pKa = 11.84TDD60 pKa = 3.51PGTLAPGYY68 pKa = 8.61ITASKK73 pKa = 9.75GGCSSVSSGSGYY85 pKa = 11.0AVDD88 pKa = 4.86RR89 pKa = 11.84KK90 pKa = 10.34LIQYY94 pKa = 7.04PHH96 pKa = 7.29NITADD101 pKa = 3.29FDD103 pKa = 5.01LNNTLDD109 pKa = 3.33QSHH112 pKa = 6.24AHH114 pKa = 6.34LAALLTAVLLYY125 pKa = 10.75DD126 pKa = 4.12PEE128 pKa = 4.85SFGLDD133 pKa = 3.49PNKK136 pKa = 10.43SRR138 pKa = 11.84SFNVSSTDD146 pKa = 3.08ANYY149 pKa = 8.65TFCVNGTVSLPNTTLGSYY167 pKa = 10.5YY168 pKa = 10.37FFNSSTWDD176 pKa = 3.61LYY178 pKa = 10.76VLEE181 pKa = 4.56LFRR184 pKa = 11.84PFVLSLLVLSIAFAA198 pKa = 4.32
Molecular weight: 21.72 kDa
Isoelectric point according different methods:
Protein with the highest isoelectric point:
>tr|A0A159D776|A0A159D776_9NIDO GP2b protein OS=Free State vervet virus OX=1737586 PE=4 SV=1
MM1 pKa = 7.17VSKK4 pKa = 10.61ICTDD8 pKa = 3.57PGYY11 pKa = 7.03TTLAFTLAPIIITMLRR27 pKa = 11.84LFRR30 pKa = 11.84PSLRR34 pKa = 11.84GFFTFIAICCLAYY47 pKa = 10.3AATAFNEE54 pKa = 4.16HH55 pKa = 6.24SLATVFTIAASILTLLWKK73 pKa = 10.46LVTWLIIRR81 pKa = 11.84CRR83 pKa = 11.84LCRR86 pKa = 11.84LGPRR90 pKa = 11.84YY91 pKa = 6.34TTAPSSFVEE100 pKa = 4.65STSGTHH106 pKa = 7.58AIPATTTAVVSRR118 pKa = 11.84RR119 pKa = 11.84QGFTLAQGSLVPDD132 pKa = 3.76VKK134 pKa = 11.26KK135 pKa = 9.79MVLSGRR141 pKa = 11.84VAAKK145 pKa = 10.16KK146 pKa = 10.68GLVTLRR152 pKa = 11.84RR153 pKa = 11.84YY154 pKa = 8.49GWKK157 pKa = 8.92TKK159 pKa = 10.31
MM1 pKa = 7.17VSKK4 pKa = 10.61ICTDD8 pKa = 3.57PGYY11 pKa = 7.03TTLAFTLAPIIITMLRR27 pKa = 11.84LFRR30 pKa = 11.84PSLRR34 pKa = 11.84GFFTFIAICCLAYY47 pKa = 10.3AATAFNEE54 pKa = 4.16HH55 pKa = 6.24SLATVFTIAASILTLLWKK73 pKa = 10.46LVTWLIIRR81 pKa = 11.84CRR83 pKa = 11.84LCRR86 pKa = 11.84LGPRR90 pKa = 11.84YY91 pKa = 6.34TTAPSSFVEE100 pKa = 4.65STSGTHH106 pKa = 7.58AIPATTTAVVSRR118 pKa = 11.84RR119 pKa = 11.84QGFTLAQGSLVPDD132 pKa = 3.76VKK134 pKa = 11.26KK135 pKa = 9.79MVLSGRR141 pKa = 11.84VAAKK145 pKa = 10.16KK146 pKa = 10.68GLVTLRR152 pKa = 11.84RR153 pKa = 11.84YY154 pKa = 8.49GWKK157 pKa = 8.92TKK159 pKa = 10.31
Molecular weight: 17.46 kDa
Isoelectric point according different methods:
Peptides (in silico digests for buttom-up proteomics)
Below you can find in silico digests of the whole proteome with Trypsin, Chymotrypsin, Trypsin+LysC, LysN, ArgC proteases suitable for different mass spec machines.| Try ESI |
 |
|---|
| ChTry ESI |
 |
|---|
| ArgC ESI |
 |
|---|
| LysN ESI |
 |
|---|
| TryLysC ESI |
 |
|---|
| Try MALDI |
 |
|---|
| ChTry MALDI |
 |
|---|
| ArgC MALDI |
 |
|---|
| LysN MALDI |
 |
|---|
| TryLysC MALDI |
 |
|---|
| Try LTQ |
 |
|---|
| ChTry LTQ |
 |
|---|
| ArgC LTQ |
 |
|---|
| LysN LTQ |
 |
|---|
| TryLysC LTQ |
 |
|---|
| Try MSlow |
 |
|---|
| ChTry MSlow |
 |
|---|
| ArgC MSlow |
 |
|---|
| LysN MSlow |
 |
|---|
| TryLysC MSlow |
 |
|---|
| Try MShigh |
 |
|---|
| ChTry MShigh |
 |
|---|
| ArgC MShigh |
 |
|---|
| LysN MShigh |
 |
|---|
| TryLysC MShigh |
 |
|---|
General Statistics
Number of major isoforms |
Number of additional isoforms |
Number of all proteins |
Number of amino acids |
Min. Seq. Length |
Max. Seq. Length |
Avg. Seq. Length |
Avg. Mol. Weight |
|---|---|---|---|---|---|---|---|
0 |
5528 |
59 |
2075 |
394.9 |
43.45 |
Amino acid frequency
Ala |
Cys |
Asp |
Glu |
Phe |
Gly |
His |
Ile |
Lys |
Leu |
|---|---|---|---|---|---|---|---|---|---|
8.285 ± 0.47 | 3.491 ± 0.203 |
4.215 ± 0.604 | 3.455 ± 0.464 |
5.065 ± 0.459 | 6.784 ± 0.619 |
2.985 ± 0.426 | 5.083 ± 0.37 |
3.889 ± 0.561 | 11.053 ± 0.96 |
Met |
Asn |
Gln |
Pro |
Arg |
Ser |
Thr |
Val |
Trp |
Tyr |
|---|---|---|---|---|---|---|---|---|---|
1.429 ± 0.139 | 3.564 ± 0.494 |
6.151 ± 0.678 | 2.75 ± 0.415 |
4.685 ± 0.277 | 7.58 ± 0.807 |
7.037 ± 0.329 | 7.218 ± 0.582 |
1.266 ± 0.224 | 4.016 ± 0.239 |
Most of the basic statistics you can see at this page can be downloaded from this CSV file
Proteome-pI is available under Creative Commons Attribution-NoDerivs license, for more details see here
| Reference: Kozlowski LP. Proteome-pI 2.0: Proteome Isoelectric Point Database Update. Nucleic Acids Res. 2021, doi: 10.1093/nar/gkab944 | Contact: Lukasz P. Kozlowski |
