Sporobolus striate mosaic virus 1
Taxonomy: Viruses; Monodnaviria; Shotokuvirae; Cressdnaviricota; Repensiviricetes; Geplafuvirales; Geminiviridae; Mastrevirus
Average proteome isoelectric point is 7.81
Get precalculated fractions of proteins

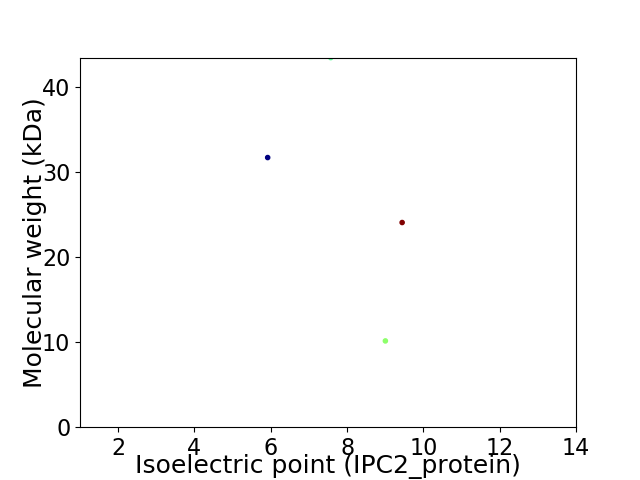
Virtual 2D-PAGE plot for 4 proteins (isoelectric point calculated using IPC2_protein)
Get csv file with sequences according to given criteria:
* You can choose from 21 different methods for calculating isoelectric point
Summary statistics related to proteome-wise predictions


Protein with the lowest isoelectric point:
>tr|J7FGY6|J7FGY6_9GEMI Capsid protein OS=Sporobolus striate mosaic virus 1 OX=1302849 PE=3 SV=1
MM1 pKa = 7.58SGPSRR6 pKa = 11.84PPSPFAISSSDD17 pKa = 3.57EE18 pKa = 3.86EE19 pKa = 4.73SVDD22 pKa = 3.39GFHH25 pKa = 7.52FRR27 pKa = 11.84GKK29 pKa = 10.35NIFLTYY35 pKa = 9.85SRR37 pKa = 11.84CEE39 pKa = 3.75IDD41 pKa = 3.31PALITDD47 pKa = 4.45ALWDD51 pKa = 3.85KK52 pKa = 10.88FSSHH56 pKa = 6.44KK57 pKa = 9.86PLYY60 pKa = 8.84ILSVRR65 pKa = 11.84EE66 pKa = 3.75LHH68 pKa = 6.12QDD70 pKa = 2.88SGFHH74 pKa = 4.54VHH76 pKa = 6.95CLVQLTDD83 pKa = 3.44QYY85 pKa = 11.42RR86 pKa = 11.84SRR88 pKa = 11.84DD89 pKa = 3.35SSFADD94 pKa = 3.86LGGNHH99 pKa = 7.05PNIQTVRR106 pKa = 11.84SATKK110 pKa = 9.1VKK112 pKa = 10.33EE113 pKa = 4.27YY114 pKa = 10.36ILKK117 pKa = 10.53EE118 pKa = 3.96PVSQSARR125 pKa = 11.84GKK127 pKa = 9.65FVAPGGRR134 pKa = 11.84PPKK137 pKa = 9.23HH138 pKa = 5.48TDD140 pKa = 2.61RR141 pKa = 11.84RR142 pKa = 11.84RR143 pKa = 11.84SDD145 pKa = 3.34SAVKK149 pKa = 10.12DD150 pKa = 3.2EE151 pKa = 3.94RR152 pKa = 11.84MRR154 pKa = 11.84YY155 pKa = 8.78ILRR158 pKa = 11.84TATTRR163 pKa = 11.84DD164 pKa = 3.68DD165 pKa = 3.7YY166 pKa = 11.77LGMVRR171 pKa = 11.84KK172 pKa = 10.03SFPFEE177 pKa = 3.34WATRR181 pKa = 11.84LAQFEE186 pKa = 4.38YY187 pKa = 10.43SASKK191 pKa = 10.39LFPDD195 pKa = 4.37ITPQYY200 pKa = 9.08QSQYY204 pKa = 7.53QTTDD208 pKa = 3.34LTCHH212 pKa = 6.28EE213 pKa = 5.28NLLDD217 pKa = 4.03WYY219 pKa = 10.65QEE221 pKa = 3.84NLQCYY226 pKa = 8.27IVSPFAYY233 pKa = 9.77SCLHH237 pKa = 6.07PAEE240 pKa = 4.96DD241 pKa = 5.08AEE243 pKa = 5.93SDD245 pKa = 4.31LKK247 pKa = 11.08WMADD251 pKa = 3.39VTRR254 pKa = 11.84TEE256 pKa = 3.97QGAGNPSTSADD267 pKa = 3.19QLVPVRR273 pKa = 11.84NLGPGCC279 pKa = 4.02
MM1 pKa = 7.58SGPSRR6 pKa = 11.84PPSPFAISSSDD17 pKa = 3.57EE18 pKa = 3.86EE19 pKa = 4.73SVDD22 pKa = 3.39GFHH25 pKa = 7.52FRR27 pKa = 11.84GKK29 pKa = 10.35NIFLTYY35 pKa = 9.85SRR37 pKa = 11.84CEE39 pKa = 3.75IDD41 pKa = 3.31PALITDD47 pKa = 4.45ALWDD51 pKa = 3.85KK52 pKa = 10.88FSSHH56 pKa = 6.44KK57 pKa = 9.86PLYY60 pKa = 8.84ILSVRR65 pKa = 11.84EE66 pKa = 3.75LHH68 pKa = 6.12QDD70 pKa = 2.88SGFHH74 pKa = 4.54VHH76 pKa = 6.95CLVQLTDD83 pKa = 3.44QYY85 pKa = 11.42RR86 pKa = 11.84SRR88 pKa = 11.84DD89 pKa = 3.35SSFADD94 pKa = 3.86LGGNHH99 pKa = 7.05PNIQTVRR106 pKa = 11.84SATKK110 pKa = 9.1VKK112 pKa = 10.33EE113 pKa = 4.27YY114 pKa = 10.36ILKK117 pKa = 10.53EE118 pKa = 3.96PVSQSARR125 pKa = 11.84GKK127 pKa = 9.65FVAPGGRR134 pKa = 11.84PPKK137 pKa = 9.23HH138 pKa = 5.48TDD140 pKa = 2.61RR141 pKa = 11.84RR142 pKa = 11.84RR143 pKa = 11.84SDD145 pKa = 3.34SAVKK149 pKa = 10.12DD150 pKa = 3.2EE151 pKa = 3.94RR152 pKa = 11.84MRR154 pKa = 11.84YY155 pKa = 8.78ILRR158 pKa = 11.84TATTRR163 pKa = 11.84DD164 pKa = 3.68DD165 pKa = 3.7YY166 pKa = 11.77LGMVRR171 pKa = 11.84KK172 pKa = 10.03SFPFEE177 pKa = 3.34WATRR181 pKa = 11.84LAQFEE186 pKa = 4.38YY187 pKa = 10.43SASKK191 pKa = 10.39LFPDD195 pKa = 4.37ITPQYY200 pKa = 9.08QSQYY204 pKa = 7.53QTTDD208 pKa = 3.34LTCHH212 pKa = 6.28EE213 pKa = 5.28NLLDD217 pKa = 4.03WYY219 pKa = 10.65QEE221 pKa = 3.84NLQCYY226 pKa = 8.27IVSPFAYY233 pKa = 9.77SCLHH237 pKa = 6.07PAEE240 pKa = 4.96DD241 pKa = 5.08AEE243 pKa = 5.93SDD245 pKa = 4.31LKK247 pKa = 11.08WMADD251 pKa = 3.39VTRR254 pKa = 11.84TEE256 pKa = 3.97QGAGNPSTSADD267 pKa = 3.19QLVPVRR273 pKa = 11.84NLGPGCC279 pKa = 4.02
Molecular weight: 31.67 kDa
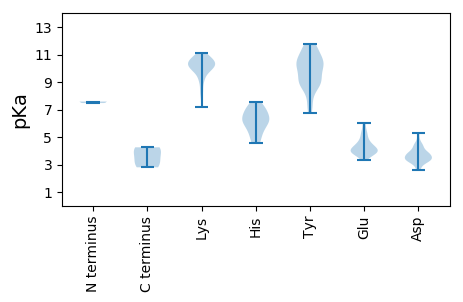
Isoelectric point according different methods:
Protein with the highest isoelectric point:
>tr|J7FHN0|J7FHN0_9GEMI Movement protein OS=Sporobolus striate mosaic virus 1 OX=1302849 PE=3 SV=1
MM1 pKa = 7.5EE2 pKa = 6.04AGHH5 pKa = 7.11LPSQQGFPSPLAYY18 pKa = 10.28SQPSPSGVGNDD29 pKa = 3.76SAWRR33 pKa = 11.84TLVLVFTITAVGLACSFALYY53 pKa = 10.0RR54 pKa = 11.84LCVKK58 pKa = 10.71DD59 pKa = 4.79LVLLLRR65 pKa = 11.84AKK67 pKa = 10.48RR68 pKa = 11.84SRR70 pKa = 11.84TVTEE74 pKa = 4.4LGFGGTPARR83 pKa = 11.84QDD85 pKa = 3.35GVRR88 pKa = 11.84TGSGVPGLGG97 pKa = 3.22
MM1 pKa = 7.5EE2 pKa = 6.04AGHH5 pKa = 7.11LPSQQGFPSPLAYY18 pKa = 10.28SQPSPSGVGNDD29 pKa = 3.76SAWRR33 pKa = 11.84TLVLVFTITAVGLACSFALYY53 pKa = 10.0RR54 pKa = 11.84LCVKK58 pKa = 10.71DD59 pKa = 4.79LVLLLRR65 pKa = 11.84AKK67 pKa = 10.48RR68 pKa = 11.84SRR70 pKa = 11.84TVTEE74 pKa = 4.4LGFGGTPARR83 pKa = 11.84QDD85 pKa = 3.35GVRR88 pKa = 11.84TGSGVPGLGG97 pKa = 3.22
Molecular weight: 10.13 kDa
Isoelectric point according different methods:
Peptides (in silico digests for buttom-up proteomics)
Below you can find in silico digests of the whole proteome with Trypsin, Chymotrypsin, Trypsin+LysC, LysN, ArgC proteases suitable for different mass spec machines.| Try ESI |
 |
|---|
| ChTry ESI |
 |
|---|
| ArgC ESI |
 |
|---|
| LysN ESI |
 |
|---|
| TryLysC ESI |
 |
|---|
| Try MALDI |
 |
|---|
| ChTry MALDI |
 |
|---|
| ArgC MALDI |
 |
|---|
| LysN MALDI |
 |
|---|
| TryLysC MALDI |
 |
|---|
| Try LTQ |
 |
|---|
| ChTry LTQ |
 |
|---|
| ArgC LTQ |
 |
|---|
| LysN LTQ |
 |
|---|
| TryLysC LTQ |
 |
|---|
| Try MSlow |
 |
|---|
| ChTry MSlow |
 |
|---|
| ArgC MSlow |
 |
|---|
| LysN MSlow |
 |
|---|
| TryLysC MSlow |
 |
|---|
| Try MShigh |
 |
|---|
| ChTry MShigh |
 |
|---|
| ArgC MShigh |
 |
|---|
| LysN MShigh |
 |
|---|
| TryLysC MShigh |
 |
|---|
General Statistics
Number of major isoforms |
Number of additional isoforms |
Number of all proteins |
Number of amino acids |
Min. Seq. Length |
Max. Seq. Length |
Avg. Seq. Length |
Avg. Mol. Weight |
|---|---|---|---|---|---|---|---|
0 |
963 |
97 |
375 |
240.8 |
27.31 |
Amino acid frequency
Ala |
Cys |
Asp |
Glu |
Phe |
Gly |
His |
Ile |
Lys |
Leu |
|---|---|---|---|---|---|---|---|---|---|
6.438 ± 0.599 | 1.765 ± 0.369 |
6.231 ± 0.911 | 4.154 ± 0.501 |
4.777 ± 0.156 | 6.646 ± 1.316 |
2.7 ± 0.329 | 4.154 ± 0.677 |
4.984 ± 0.657 | 7.892 ± 0.884 |
Met |
Asn |
Gln |
Pro |
Arg |
Ser |
Thr |
Val |
Trp |
Tyr |
|---|---|---|---|---|---|---|---|---|---|
1.765 ± 0.202 | 3.115 ± 0.504 |
6.231 ± 0.294 | 4.673 ± 0.312 |
7.061 ± 0.201 | 8.307 ± 0.916 |
5.815 ± 0.269 | 6.646 ± 1.463 |
1.765 ± 0.202 | 4.881 ± 0.549 |
Most of the basic statistics you can see at this page can be downloaded from this CSV file
Proteome-pI is available under Creative Commons Attribution-NoDerivs license, for more details see here
| Reference: Kozlowski LP. Proteome-pI 2.0: Proteome Isoelectric Point Database Update. Nucleic Acids Res. 2021, doi: 10.1093/nar/gkab944 | Contact: Lukasz P. Kozlowski |
