Tuber borchii (White truffle)
Taxonomy: cellular organisms; Eukaryota; Opisthokonta; Fungi; Dikarya; Ascomycota; saccharomyceta; Pezizomycotina; Pezizomycetes; Pezizales; Tuberaceae; Tuber
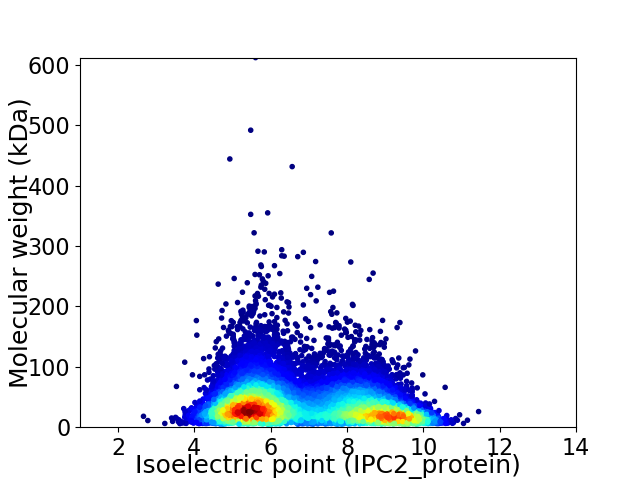
Average proteome isoelectric point is 6.88
Get precalculated fractions of proteins

Virtual 2D-PAGE plot for 12324 proteins (isoelectric point calculated using IPC2_protein)
Get csv file with sequences according to given criteria:
* You can choose from 21 different methods for calculating isoelectric point
Summary statistics related to proteome-wise predictions


Protein with the lowest isoelectric point:
>tr|A0A2T6ZW64|A0A2T6ZW64_TUBBO Uncharacterized protein OS=Tuber borchii OX=42251 GN=B9Z19DRAFT_794141 PE=4 SV=1
MM1 pKa = 7.44SISLEE6 pKa = 4.21GEE8 pKa = 4.12HH9 pKa = 6.77KK10 pKa = 10.52CIEE13 pKa = 4.16RR14 pKa = 11.84STEE17 pKa = 4.03CDD19 pKa = 3.33CPICGEE25 pKa = 4.19YY26 pKa = 10.09MFTSTQTVVFMTCGHH41 pKa = 6.78SIHH44 pKa = 5.81QRR46 pKa = 11.84CYY48 pKa = 7.74YY49 pKa = 11.25DD50 pKa = 3.76HH51 pKa = 7.08MKK53 pKa = 9.99TSYY56 pKa = 10.56RR57 pKa = 11.84CPTCARR63 pKa = 11.84TIINMEE69 pKa = 4.04SQFRR73 pKa = 11.84ALDD76 pKa = 3.93LEE78 pKa = 5.09IEE80 pKa = 4.4TQPLPEE86 pKa = 4.99PYY88 pKa = 10.45KK89 pKa = 10.63NWRR92 pKa = 11.84CLIGCNDD99 pKa = 4.28CSAKK103 pKa = 10.91SNVLFHH109 pKa = 7.02FLGLKK114 pKa = 10.26CEE116 pKa = 4.12NCKK119 pKa = 10.66SYY121 pKa = 9.31NTNQIRR127 pKa = 11.84ILRR130 pKa = 11.84PEE132 pKa = 4.66DD133 pKa = 3.75GQDD136 pKa = 3.23GGGGNMSPSAIPRR149 pKa = 11.84IPEE152 pKa = 3.78RR153 pKa = 11.84TTSSNSLLGGQANSPPRR170 pKa = 11.84LAPAEE175 pKa = 4.3GEE177 pKa = 4.05AALANANRR185 pKa = 11.84AIAAAGEE192 pKa = 4.54AIMEE196 pKa = 4.41LDD198 pKa = 3.56GVEE201 pKa = 5.34DD202 pKa = 5.68LIIDD206 pKa = 4.63DD207 pKa = 3.81GWEE210 pKa = 4.22TEE212 pKa = 4.43DD213 pKa = 4.03SADD216 pKa = 3.64YY217 pKa = 11.13TDD219 pKa = 5.59IDD221 pKa = 5.53DD222 pKa = 6.3DD223 pKa = 5.33DD224 pKa = 5.09DD225 pKa = 5.47LSGFGGDD232 pKa = 3.0GVEE235 pKa = 4.48AVEE238 pKa = 4.31EE239 pKa = 4.34DD240 pKa = 4.0SEE242 pKa = 5.0EE243 pKa = 4.12EE244 pKa = 5.17DD245 pKa = 5.07GDD247 pKa = 5.24GDD249 pKa = 6.12DD250 pKa = 6.46DD251 pKa = 7.16DD252 pKa = 7.69DD253 pKa = 7.74DD254 pKa = 7.55DD255 pKa = 7.67DD256 pKa = 7.73DD257 pKa = 7.02DD258 pKa = 7.08DD259 pKa = 5.77LIQLIGHH266 pKa = 6.78RR267 pKa = 4.35
MM1 pKa = 7.44SISLEE6 pKa = 4.21GEE8 pKa = 4.12HH9 pKa = 6.77KK10 pKa = 10.52CIEE13 pKa = 4.16RR14 pKa = 11.84STEE17 pKa = 4.03CDD19 pKa = 3.33CPICGEE25 pKa = 4.19YY26 pKa = 10.09MFTSTQTVVFMTCGHH41 pKa = 6.78SIHH44 pKa = 5.81QRR46 pKa = 11.84CYY48 pKa = 7.74YY49 pKa = 11.25DD50 pKa = 3.76HH51 pKa = 7.08MKK53 pKa = 9.99TSYY56 pKa = 10.56RR57 pKa = 11.84CPTCARR63 pKa = 11.84TIINMEE69 pKa = 4.04SQFRR73 pKa = 11.84ALDD76 pKa = 3.93LEE78 pKa = 5.09IEE80 pKa = 4.4TQPLPEE86 pKa = 4.99PYY88 pKa = 10.45KK89 pKa = 10.63NWRR92 pKa = 11.84CLIGCNDD99 pKa = 4.28CSAKK103 pKa = 10.91SNVLFHH109 pKa = 7.02FLGLKK114 pKa = 10.26CEE116 pKa = 4.12NCKK119 pKa = 10.66SYY121 pKa = 9.31NTNQIRR127 pKa = 11.84ILRR130 pKa = 11.84PEE132 pKa = 4.66DD133 pKa = 3.75GQDD136 pKa = 3.23GGGGNMSPSAIPRR149 pKa = 11.84IPEE152 pKa = 3.78RR153 pKa = 11.84TTSSNSLLGGQANSPPRR170 pKa = 11.84LAPAEE175 pKa = 4.3GEE177 pKa = 4.05AALANANRR185 pKa = 11.84AIAAAGEE192 pKa = 4.54AIMEE196 pKa = 4.41LDD198 pKa = 3.56GVEE201 pKa = 5.34DD202 pKa = 5.68LIIDD206 pKa = 4.63DD207 pKa = 3.81GWEE210 pKa = 4.22TEE212 pKa = 4.43DD213 pKa = 4.03SADD216 pKa = 3.64YY217 pKa = 11.13TDD219 pKa = 5.59IDD221 pKa = 5.53DD222 pKa = 6.3DD223 pKa = 5.33DD224 pKa = 5.09DD225 pKa = 5.47LSGFGGDD232 pKa = 3.0GVEE235 pKa = 4.48AVEE238 pKa = 4.31EE239 pKa = 4.34DD240 pKa = 4.0SEE242 pKa = 5.0EE243 pKa = 4.12EE244 pKa = 5.17DD245 pKa = 5.07GDD247 pKa = 5.24GDD249 pKa = 6.12DD250 pKa = 6.46DD251 pKa = 7.16DD252 pKa = 7.69DD253 pKa = 7.74DD254 pKa = 7.55DD255 pKa = 7.67DD256 pKa = 7.73DD257 pKa = 7.02DD258 pKa = 7.08DD259 pKa = 5.77LIQLIGHH266 pKa = 6.78RR267 pKa = 4.35
Molecular weight: 29.33 kDa
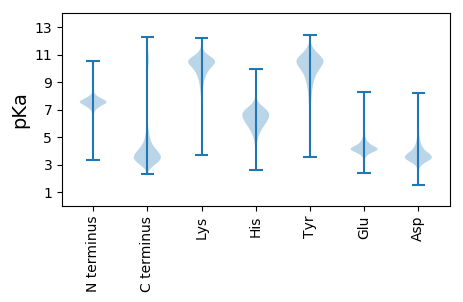
Isoelectric point according different methods:
Protein with the highest isoelectric point:
>tr|A0A2T6ZHB4|A0A2T6ZHB4_TUBBO TFIIF_beta domain-containing protein OS=Tuber borchii OX=42251 GN=B9Z19DRAFT_1132400 PE=4 SV=1
MM1 pKa = 7.38FRR3 pKa = 11.84PILRR7 pKa = 11.84PMLNQSVFRR16 pKa = 11.84PALLGKK22 pKa = 9.31VIRR25 pKa = 11.84PALVLPISPRR35 pKa = 11.84PVPAPVVLFARR46 pKa = 11.84RR47 pKa = 11.84GSSMFLLPNTNLIVLTPPSPPPKK70 pKa = 9.96WMTAALLKK78 pKa = 10.55SSPRR82 pKa = 11.84SMGSFNQLRR91 pKa = 11.84MISKK95 pKa = 9.27WLVTSTSPVSS105 pKa = 3.26
MM1 pKa = 7.38FRR3 pKa = 11.84PILRR7 pKa = 11.84PMLNQSVFRR16 pKa = 11.84PALLGKK22 pKa = 9.31VIRR25 pKa = 11.84PALVLPISPRR35 pKa = 11.84PVPAPVVLFARR46 pKa = 11.84RR47 pKa = 11.84GSSMFLLPNTNLIVLTPPSPPPKK70 pKa = 9.96WMTAALLKK78 pKa = 10.55SSPRR82 pKa = 11.84SMGSFNQLRR91 pKa = 11.84MISKK95 pKa = 9.27WLVTSTSPVSS105 pKa = 3.26
Molecular weight: 11.59 kDa
Isoelectric point according different methods:
Peptides (in silico digests for buttom-up proteomics)
Below you can find in silico digests of the whole proteome with Trypsin, Chymotrypsin, Trypsin+LysC, LysN, ArgC proteases suitable for different mass spec machines.| Try ESI |
 |
|---|
| ChTry ESI |
 |
|---|
| ArgC ESI |
 |
|---|
| LysN ESI |
 |
|---|
| TryLysC ESI |
 |
|---|
| Try MALDI |
 |
|---|
| ChTry MALDI |
 |
|---|
| ArgC MALDI |
 |
|---|
| LysN MALDI |
 |
|---|
| TryLysC MALDI |
 |
|---|
| Try LTQ |
 |
|---|
| ChTry LTQ |
 |
|---|
| ArgC LTQ |
 |
|---|
| LysN LTQ |
 |
|---|
| TryLysC LTQ |
 |
|---|
| Try MSlow |
 |
|---|
| ChTry MSlow |
 |
|---|
| ArgC MSlow |
 |
|---|
| LysN MSlow |
 |
|---|
| TryLysC MSlow |
 |
|---|
| Try MShigh |
 |
|---|
| ChTry MShigh |
 |
|---|
| ArgC MShigh |
 |
|---|
| LysN MShigh |
 |
|---|
| TryLysC MShigh |
 |
|---|
General Statistics
Number of major isoforms |
Number of additional isoforms |
Number of all proteins |
Number of amino acids |
Min. Seq. Length |
Max. Seq. Length |
Avg. Seq. Length |
Avg. Mol. Weight |
|---|---|---|---|---|---|---|---|
0 |
4666832 |
49 |
5527 |
378.7 |
41.92 |
Amino acid frequency
Ala |
Cys |
Asp |
Glu |
Phe |
Gly |
His |
Ile |
Lys |
Leu |
|---|---|---|---|---|---|---|---|---|---|
7.727 ± 0.018 | 1.279 ± 0.009 |
5.205 ± 0.016 | 6.654 ± 0.028 |
3.712 ± 0.015 | 7.383 ± 0.023 |
2.336 ± 0.01 | 5.095 ± 0.017 |
5.308 ± 0.022 | 8.908 ± 0.025 |
Met |
Asn |
Gln |
Pro |
Arg |
Ser |
Thr |
Val |
Trp |
Tyr |
|---|---|---|---|---|---|---|---|---|---|
2.132 ± 0.009 | 3.668 ± 0.013 |
6.31 ± 0.03 | 3.593 ± 0.02 |
6.244 ± 0.016 | 8.361 ± 0.025 |
5.939 ± 0.02 | 6.079 ± 0.017 |
1.356 ± 0.008 | 2.71 ± 0.012 |
Most of the basic statistics you can see at this page can be downloaded from this CSV file
Proteome-pI is available under Creative Commons Attribution-NoDerivs license, for more details see here
| Reference: Kozlowski LP. Proteome-pI 2.0: Proteome Isoelectric Point Database Update. Nucleic Acids Res. 2021, doi: 10.1093/nar/gkab944 | Contact: Lukasz P. Kozlowski |
