Brassica cretica (Mustard)
Taxonomy: cellular organisms; Eukaryota; Viridiplantae; Streptophyta; Streptophytina; Embryophyta; Tracheophyta; Euphyllophyta; Spermatophyta; Magnoliopsida; Mesangiospermae; eudicotyledons; Gunneridae; Pentapetalae; rosids; malvids; Brassicales; Brassicaceae; Brassiceae; Brassica
Average proteome isoelectric point is 6.84
Get precalculated fractions of proteins

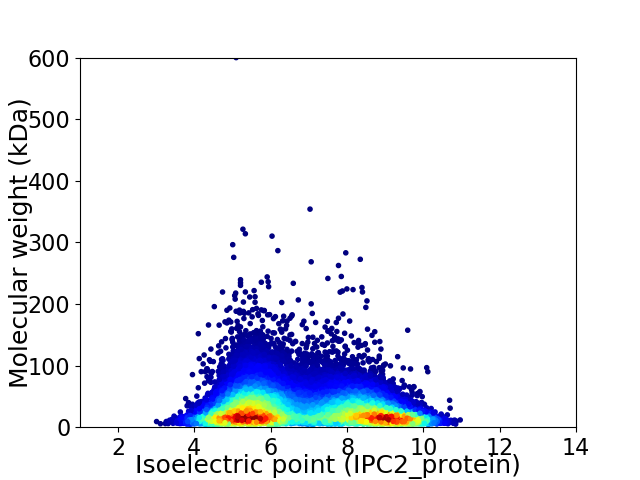
Virtual 2D-PAGE plot for 30345 proteins (isoelectric point calculated using IPC2_protein)
Get csv file with sequences according to given criteria:
* You can choose from 21 different methods for calculating isoelectric point
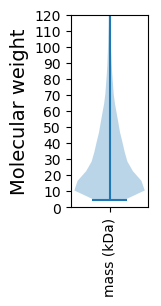
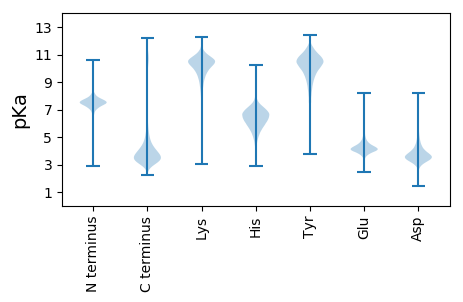
Summary statistics related to proteome-wise predictions


Protein with the lowest isoelectric point:
>tr|A0A3N6UTK2|A0A3N6UTK2_BRACR Uncharacterized protein OS=Brassica cretica OX=69181 GN=DY000_00030940 PE=4 SV=1
MM1 pKa = 8.0VSITHH6 pKa = 7.11KK7 pKa = 10.52DD8 pKa = 3.55DD9 pKa = 4.15QIVEE13 pKa = 4.42SKK15 pKa = 10.62EE16 pKa = 3.49IMPISSPKK24 pKa = 9.38NAYY27 pKa = 9.55GSNSDD32 pKa = 4.06EE33 pKa = 5.34LNDD36 pKa = 3.69TDD38 pKa = 3.8EE39 pKa = 4.97EE40 pKa = 4.46EE41 pKa = 5.21VNVCDD46 pKa = 3.48TCGVQGFTNKK56 pKa = 10.03LAICDD61 pKa = 3.74NCGVGAEE68 pKa = 4.23HH69 pKa = 7.04TYY71 pKa = 11.47YY72 pKa = 10.14MAEE75 pKa = 4.11KK76 pKa = 10.7LEE78 pKa = 4.42DD79 pKa = 3.51VPEE82 pKa = 4.02RR83 pKa = 11.84WSCNDD88 pKa = 3.1CVEE91 pKa = 4.27MGEE94 pKa = 5.86SEE96 pKa = 4.21FQKK99 pKa = 10.96QNDD102 pKa = 3.56LSTQKK107 pKa = 10.59SSEE110 pKa = 4.37TVGPDD115 pKa = 4.0LNIEE119 pKa = 4.25PNLNLNPNIDD129 pKa = 4.28LNLDD133 pKa = 3.38PSTDD137 pKa = 3.62LNVNPNLDD145 pKa = 4.18LNLDD149 pKa = 3.81MNLDD153 pKa = 4.17PNLHH157 pKa = 6.44LSVDD161 pKa = 3.77NNLDD165 pKa = 3.4LSLDD169 pKa = 3.79CGSYY173 pKa = 9.36YY174 pKa = 10.47QPSSTSNFQAHH185 pKa = 4.94TRR187 pKa = 11.84MRR189 pKa = 11.84ASPNPLLGPGSLEE202 pKa = 4.1EE203 pKa = 4.33EE204 pKa = 4.37EE205 pKa = 4.94EE206 pKa = 4.28EE207 pKa = 4.48
MM1 pKa = 8.0VSITHH6 pKa = 7.11KK7 pKa = 10.52DD8 pKa = 3.55DD9 pKa = 4.15QIVEE13 pKa = 4.42SKK15 pKa = 10.62EE16 pKa = 3.49IMPISSPKK24 pKa = 9.38NAYY27 pKa = 9.55GSNSDD32 pKa = 4.06EE33 pKa = 5.34LNDD36 pKa = 3.69TDD38 pKa = 3.8EE39 pKa = 4.97EE40 pKa = 4.46EE41 pKa = 5.21VNVCDD46 pKa = 3.48TCGVQGFTNKK56 pKa = 10.03LAICDD61 pKa = 3.74NCGVGAEE68 pKa = 4.23HH69 pKa = 7.04TYY71 pKa = 11.47YY72 pKa = 10.14MAEE75 pKa = 4.11KK76 pKa = 10.7LEE78 pKa = 4.42DD79 pKa = 3.51VPEE82 pKa = 4.02RR83 pKa = 11.84WSCNDD88 pKa = 3.1CVEE91 pKa = 4.27MGEE94 pKa = 5.86SEE96 pKa = 4.21FQKK99 pKa = 10.96QNDD102 pKa = 3.56LSTQKK107 pKa = 10.59SSEE110 pKa = 4.37TVGPDD115 pKa = 4.0LNIEE119 pKa = 4.25PNLNLNPNIDD129 pKa = 4.28LNLDD133 pKa = 3.38PSTDD137 pKa = 3.62LNVNPNLDD145 pKa = 4.18LNLDD149 pKa = 3.81MNLDD153 pKa = 4.17PNLHH157 pKa = 6.44LSVDD161 pKa = 3.77NNLDD165 pKa = 3.4LSLDD169 pKa = 3.79CGSYY173 pKa = 9.36YY174 pKa = 10.47QPSSTSNFQAHH185 pKa = 4.94TRR187 pKa = 11.84MRR189 pKa = 11.84ASPNPLLGPGSLEE202 pKa = 4.1EE203 pKa = 4.33EE204 pKa = 4.37EE205 pKa = 4.94EE206 pKa = 4.28EE207 pKa = 4.48
Molecular weight: 22.92 kDa
Isoelectric point according different methods:
Protein with the highest isoelectric point:
>tr|A0A3N6R561|A0A3N6R561_BRACR Laccase OS=Brassica cretica OX=69181 GN=DY000_00018611 PE=3 SV=1
MM1 pKa = 7.53AANGVRR7 pKa = 11.84RR8 pKa = 11.84ALHH11 pKa = 6.11SSSSTGRR18 pKa = 11.84ILFSRR23 pKa = 11.84SSSVPKK29 pKa = 10.13LGKK32 pKa = 9.73SAGFAFGNGSSSSRR46 pKa = 11.84SSLRR50 pKa = 11.84RR51 pKa = 11.84LTSSS55 pKa = 2.95
MM1 pKa = 7.53AANGVRR7 pKa = 11.84RR8 pKa = 11.84ALHH11 pKa = 6.11SSSSTGRR18 pKa = 11.84ILFSRR23 pKa = 11.84SSSVPKK29 pKa = 10.13LGKK32 pKa = 9.73SAGFAFGNGSSSSRR46 pKa = 11.84SSLRR50 pKa = 11.84RR51 pKa = 11.84LTSSS55 pKa = 2.95
Molecular weight: 5.66 kDa
Isoelectric point according different methods:
Peptides (in silico digests for buttom-up proteomics)
Below you can find in silico digests of the whole proteome with Trypsin, Chymotrypsin, Trypsin+LysC, LysN, ArgC proteases suitable for different mass spec machines.| Try ESI |
 |
|---|
| ChTry ESI |
 |
|---|
| ArgC ESI |
 |
|---|
| LysN ESI |
 |
|---|
| TryLysC ESI |
 |
|---|
| Try MALDI |
 |
|---|
| ChTry MALDI |
 |
|---|
| ArgC MALDI |
 |
|---|
| LysN MALDI |
 |
|---|
| TryLysC MALDI |
 |
|---|
| Try LTQ |
 |
|---|
| ChTry LTQ |
 |
|---|
| ArgC LTQ |
 |
|---|
| LysN LTQ |
 |
|---|
| TryLysC LTQ |
 |
|---|
| Try MSlow |
 |
|---|
| ChTry MSlow |
 |
|---|
| ArgC MSlow |
 |
|---|
| LysN MSlow |
 |
|---|
| TryLysC MSlow |
 |
|---|
| Try MShigh |
 |
|---|
| ChTry MShigh |
 |
|---|
| ArgC MShigh |
 |
|---|
| LysN MShigh |
 |
|---|
| TryLysC MShigh |
 |
|---|
General Statistics
Number of major isoforms |
Number of additional isoforms |
Number of all proteins |
Number of amino acids |
Min. Seq. Length |
Max. Seq. Length |
Avg. Seq. Length |
Avg. Mol. Weight |
|---|---|---|---|---|---|---|---|
0 |
9102698 |
49 |
5306 |
300.0 |
33.53 |
Amino acid frequency
Ala |
Cys |
Asp |
Glu |
Phe |
Gly |
His |
Ile |
Lys |
Leu |
|---|---|---|---|---|---|---|---|---|---|
6.479 ± 0.016 | 1.838 ± 0.007 |
5.381 ± 0.011 | 6.805 ± 0.023 |
4.116 ± 0.009 | 6.402 ± 0.015 |
2.346 ± 0.007 | 4.969 ± 0.01 |
6.03 ± 0.017 | 9.489 ± 0.018 |
Met |
Asn |
Gln |
Pro |
Arg |
Ser |
Thr |
Val |
Trp |
Tyr |
|---|---|---|---|---|---|---|---|---|---|
2.476 ± 0.006 | 4.111 ± 0.01 |
5.025 ± 0.017 | 3.502 ± 0.009 |
5.908 ± 0.015 | 9.274 ± 0.016 |
5.225 ± 0.011 | 6.699 ± 0.012 |
1.285 ± 0.005 | 2.64 ± 0.008 |
Most of the basic statistics you can see at this page can be downloaded from this CSV file
Proteome-pI is available under Creative Commons Attribution-NoDerivs license, for more details see here
| Reference: Kozlowski LP. Proteome-pI 2.0: Proteome Isoelectric Point Database Update. Nucleic Acids Res. 2021, doi: 10.1093/nar/gkab944 | Contact: Lukasz P. Kozlowski |
