Pseudodesulfovibrio piezophilus (strain DSM 21447 / JCM 15486 / C1TLV30) (Desulfovibrio piezophilus)
Taxonomy: cellular organisms; Bacteria; Proteobacteria; delta/epsilon subdivisions; Deltaproteobacteria; Desulfovibrionales; Desulfovibrionaceae; Pseudodesulfovibrio; Pseudodesulfovibrio piezophilus
Average proteome isoelectric point is 6.27
Get precalculated fractions of proteins

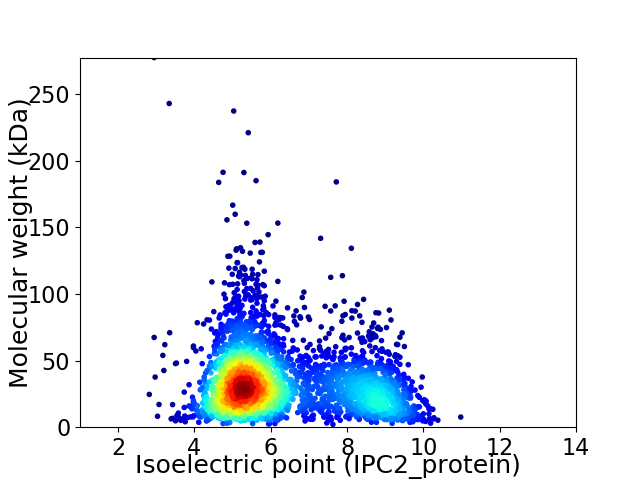
Virtual 2D-PAGE plot for 3342 proteins (isoelectric point calculated using IPC2_protein)
Get csv file with sequences according to given criteria:
* You can choose from 21 different methods for calculating isoelectric point
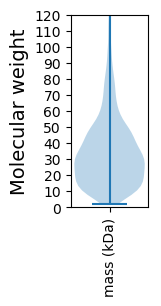
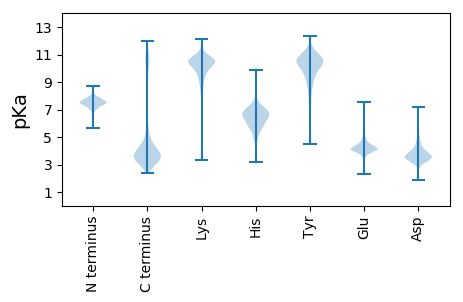
Summary statistics related to proteome-wise predictions


Protein with the lowest isoelectric point:
>tr|M1WKU8|M1WKU8_PSEP2 Formate dehydrogenase subunit alpha OS=Pseudodesulfovibrio piezophilus (strain DSM 21447 / JCM 15486 / C1TLV30) OX=1322246 GN=fdhA PE=3 SV=1
MM1 pKa = 7.3TRR3 pKa = 11.84FSVQATSSSPHH14 pKa = 7.43IEE16 pKa = 3.98FDD18 pKa = 3.58PEE20 pKa = 4.15TMSFEE25 pKa = 4.54IKK27 pKa = 10.62GEE29 pKa = 4.17SYY31 pKa = 10.87PEE33 pKa = 4.03NCWAFYY39 pKa = 11.2GPMFDD44 pKa = 3.1WLEE47 pKa = 4.16TFFSGINGDD56 pKa = 3.22RR57 pKa = 11.84VEE59 pKa = 4.44INMEE63 pKa = 3.57ILYY66 pKa = 10.36FNSSSSKK73 pKa = 9.34TFMDD77 pKa = 4.61FFDD80 pKa = 4.29MLDD83 pKa = 3.79DD84 pKa = 4.59QAEE87 pKa = 4.0QGNNIVVNWRR97 pKa = 11.84YY98 pKa = 10.0HH99 pKa = 5.48EE100 pKa = 4.58EE101 pKa = 3.99NEE103 pKa = 4.34SAMEE107 pKa = 4.31CGEE110 pKa = 4.02EE111 pKa = 4.02FMEE114 pKa = 5.46DD115 pKa = 3.42VSCIKK120 pKa = 10.63FNLVEE125 pKa = 4.81FNDD128 pKa = 3.79EE129 pKa = 4.47SEE131 pKa = 4.38CC132 pKa = 4.72
MM1 pKa = 7.3TRR3 pKa = 11.84FSVQATSSSPHH14 pKa = 7.43IEE16 pKa = 3.98FDD18 pKa = 3.58PEE20 pKa = 4.15TMSFEE25 pKa = 4.54IKK27 pKa = 10.62GEE29 pKa = 4.17SYY31 pKa = 10.87PEE33 pKa = 4.03NCWAFYY39 pKa = 11.2GPMFDD44 pKa = 3.1WLEE47 pKa = 4.16TFFSGINGDD56 pKa = 3.22RR57 pKa = 11.84VEE59 pKa = 4.44INMEE63 pKa = 3.57ILYY66 pKa = 10.36FNSSSSKK73 pKa = 9.34TFMDD77 pKa = 4.61FFDD80 pKa = 4.29MLDD83 pKa = 3.79DD84 pKa = 4.59QAEE87 pKa = 4.0QGNNIVVNWRR97 pKa = 11.84YY98 pKa = 10.0HH99 pKa = 5.48EE100 pKa = 4.58EE101 pKa = 3.99NEE103 pKa = 4.34SAMEE107 pKa = 4.31CGEE110 pKa = 4.02EE111 pKa = 4.02FMEE114 pKa = 5.46DD115 pKa = 3.42VSCIKK120 pKa = 10.63FNLVEE125 pKa = 4.81FNDD128 pKa = 3.79EE129 pKa = 4.47SEE131 pKa = 4.38CC132 pKa = 4.72
Molecular weight: 15.47 kDa
Isoelectric point according different methods:
Protein with the highest isoelectric point:
>tr|M1WL06|M1WL06_PSEP2 Hydrogenase maturation factor OS=Pseudodesulfovibrio piezophilus (strain DSM 21447 / JCM 15486 / C1TLV30) OX=1322246 GN=hypD PE=3 SV=1
MM1 pKa = 7.7PKK3 pKa = 9.95IKK5 pKa = 9.47TRR7 pKa = 11.84RR8 pKa = 11.84AAAKK12 pKa = 9.74RR13 pKa = 11.84FSKK16 pKa = 9.7TATGKK21 pKa = 10.1FKK23 pKa = 10.74RR24 pKa = 11.84RR25 pKa = 11.84RR26 pKa = 11.84KK27 pKa = 9.07NLRR30 pKa = 11.84HH31 pKa = 6.24ILTKK35 pKa = 10.67KK36 pKa = 7.68NAKK39 pKa = 9.22RR40 pKa = 11.84KK41 pKa = 9.18RR42 pKa = 11.84RR43 pKa = 11.84LGQSTTVDD51 pKa = 3.67STNMKK56 pKa = 9.79AVRR59 pKa = 11.84RR60 pKa = 11.84QLPNGG65 pKa = 3.51
MM1 pKa = 7.7PKK3 pKa = 9.95IKK5 pKa = 9.47TRR7 pKa = 11.84RR8 pKa = 11.84AAAKK12 pKa = 9.74RR13 pKa = 11.84FSKK16 pKa = 9.7TATGKK21 pKa = 10.1FKK23 pKa = 10.74RR24 pKa = 11.84RR25 pKa = 11.84RR26 pKa = 11.84KK27 pKa = 9.07NLRR30 pKa = 11.84HH31 pKa = 6.24ILTKK35 pKa = 10.67KK36 pKa = 7.68NAKK39 pKa = 9.22RR40 pKa = 11.84KK41 pKa = 9.18RR42 pKa = 11.84RR43 pKa = 11.84LGQSTTVDD51 pKa = 3.67STNMKK56 pKa = 9.79AVRR59 pKa = 11.84RR60 pKa = 11.84QLPNGG65 pKa = 3.51
Molecular weight: 7.59 kDa
Isoelectric point according different methods:
Peptides (in silico digests for buttom-up proteomics)
Below you can find in silico digests of the whole proteome with Trypsin, Chymotrypsin, Trypsin+LysC, LysN, ArgC proteases suitable for different mass spec machines.| Try ESI |
 |
|---|
| ChTry ESI |
 |
|---|
| ArgC ESI |
 |
|---|
| LysN ESI |
 |
|---|
| TryLysC ESI |
 |
|---|
| Try MALDI |
 |
|---|
| ChTry MALDI |
 |
|---|
| ArgC MALDI |
 |
|---|
| LysN MALDI |
 |
|---|
| TryLysC MALDI |
 |
|---|
| Try LTQ |
 |
|---|
| ChTry LTQ |
 |
|---|
| ArgC LTQ |
 |
|---|
| LysN LTQ |
 |
|---|
| TryLysC LTQ |
 |
|---|
| Try MSlow |
 |
|---|
| ChTry MSlow |
 |
|---|
| ArgC MSlow |
 |
|---|
| LysN MSlow |
 |
|---|
| TryLysC MSlow |
 |
|---|
| Try MShigh |
 |
|---|
| ChTry MShigh |
 |
|---|
| ArgC MShigh |
 |
|---|
| LysN MShigh |
 |
|---|
| TryLysC MShigh |
 |
|---|
General Statistics
Number of major isoforms |
Number of additional isoforms |
Number of all proteins |
Number of amino acids |
Min. Seq. Length |
Max. Seq. Length |
Avg. Seq. Length |
Avg. Mol. Weight |
|---|---|---|---|---|---|---|---|
0 |
1080842 |
20 |
2728 |
323.4 |
35.81 |
Amino acid frequency
Ala |
Cys |
Asp |
Glu |
Phe |
Gly |
His |
Ile |
Lys |
Leu |
|---|---|---|---|---|---|---|---|---|---|
8.611 ± 0.049 | 1.316 ± 0.018 |
5.606 ± 0.031 | 6.71 ± 0.039 |
4.258 ± 0.028 | 7.75 ± 0.04 |
2.209 ± 0.02 | 6.155 ± 0.033 |
5.257 ± 0.042 | 10.211 ± 0.043 |
Met |
Asn |
Gln |
Pro |
Arg |
Ser |
Thr |
Val |
Trp |
Tyr |
|---|---|---|---|---|---|---|---|---|---|
2.992 ± 0.021 | 3.376 ± 0.023 |
4.392 ± 0.031 | 3.352 ± 0.024 |
5.415 ± 0.034 | 6.043 ± 0.033 |
5.46 ± 0.036 | 7.015 ± 0.035 |
1.148 ± 0.017 | 2.721 ± 0.021 |
Most of the basic statistics you can see at this page can be downloaded from this CSV file
Proteome-pI is available under Creative Commons Attribution-NoDerivs license, for more details see here
| Reference: Kozlowski LP. Proteome-pI 2.0: Proteome Isoelectric Point Database Update. Nucleic Acids Res. 2021, doi: 10.1093/nar/gkab944 | Contact: Lukasz P. Kozlowski |
