Cellulophaga phage phi12a:1
Taxonomy: Viruses; Monodnaviria; Sangervirae; Phixviricota; Malgrandaviricetes; Petitvirales; Microviridae; unclassified Microviridae
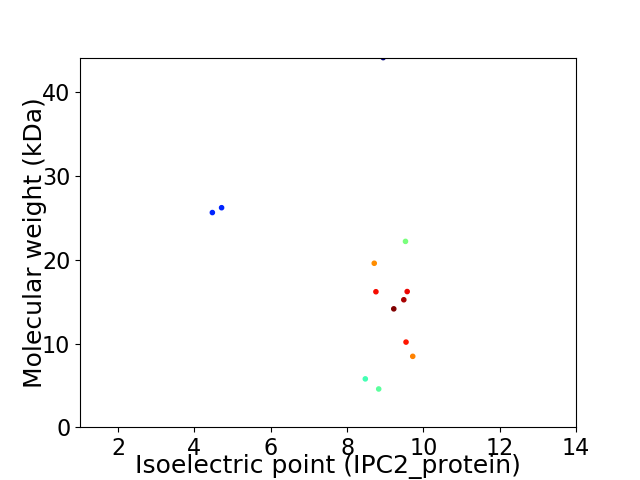
Average proteome isoelectric point is 8.3
Get precalculated fractions of proteins

Virtual 2D-PAGE plot for 13 proteins (isoelectric point calculated using IPC2_protein)
Get csv file with sequences according to given criteria:
* You can choose from 21 different methods for calculating isoelectric point
Summary statistics related to proteome-wise predictions


Protein with the lowest isoelectric point:
>tr|S0A338|S0A338_9VIRU Replication initiation factor OS=Cellulophaga phage phi12a:1 OX=1327987 GN=Phi12a:1_pg2 PE=4 SV=1
MM1 pKa = 6.9VVGYY5 pKa = 8.65FIGVNRR11 pKa = 11.84DD12 pKa = 3.22FKK14 pKa = 11.19LIEE17 pKa = 4.14IPVLFEE23 pKa = 4.11NEE25 pKa = 3.64IFSTKK30 pKa = 9.86EE31 pKa = 3.37FFEE34 pKa = 4.69DD35 pKa = 3.67VLLFDD40 pKa = 5.88LFINQQRR47 pKa = 11.84YY48 pKa = 7.89FYY50 pKa = 10.42RR51 pKa = 11.84GFNAAEE57 pKa = 3.57THH59 pKa = 6.1AFNNTLSVEE68 pKa = 4.87LIQEE72 pKa = 4.15RR73 pKa = 11.84YY74 pKa = 9.11FRR76 pKa = 11.84SEE78 pKa = 3.88GQKK81 pKa = 10.78LEE83 pKa = 4.21FNMEE87 pKa = 4.17YY88 pKa = 10.08IFRR91 pKa = 11.84LSCCDD96 pKa = 3.25FTSRR100 pKa = 11.84IPSRR104 pKa = 11.84SEE106 pKa = 3.46LALPDD111 pKa = 3.98YY112 pKa = 11.29DD113 pKa = 4.49PLFTFNVVNGPNSNYY128 pKa = 9.28PLHH131 pKa = 6.33NFAYY135 pKa = 10.07GLYY138 pKa = 8.39STGGQFIPTIIEE150 pKa = 3.96DD151 pKa = 4.47FKK153 pKa = 11.63ADD155 pKa = 3.46TNTVVWQYY163 pKa = 11.37RR164 pKa = 11.84LSDD167 pKa = 3.69VVGKK171 pKa = 9.86EE172 pKa = 3.38IAFIAFDD179 pKa = 4.35PNGSNVFTLEE189 pKa = 3.85VDD191 pKa = 4.23GVQYY195 pKa = 10.87AQEE198 pKa = 4.3GYY200 pKa = 9.79IYY202 pKa = 11.01VFGSQSADD210 pKa = 3.22VVKK213 pKa = 9.7TVIINQTLQQ222 pKa = 2.93
MM1 pKa = 6.9VVGYY5 pKa = 8.65FIGVNRR11 pKa = 11.84DD12 pKa = 3.22FKK14 pKa = 11.19LIEE17 pKa = 4.14IPVLFEE23 pKa = 4.11NEE25 pKa = 3.64IFSTKK30 pKa = 9.86EE31 pKa = 3.37FFEE34 pKa = 4.69DD35 pKa = 3.67VLLFDD40 pKa = 5.88LFINQQRR47 pKa = 11.84YY48 pKa = 7.89FYY50 pKa = 10.42RR51 pKa = 11.84GFNAAEE57 pKa = 3.57THH59 pKa = 6.1AFNNTLSVEE68 pKa = 4.87LIQEE72 pKa = 4.15RR73 pKa = 11.84YY74 pKa = 9.11FRR76 pKa = 11.84SEE78 pKa = 3.88GQKK81 pKa = 10.78LEE83 pKa = 4.21FNMEE87 pKa = 4.17YY88 pKa = 10.08IFRR91 pKa = 11.84LSCCDD96 pKa = 3.25FTSRR100 pKa = 11.84IPSRR104 pKa = 11.84SEE106 pKa = 3.46LALPDD111 pKa = 3.98YY112 pKa = 11.29DD113 pKa = 4.49PLFTFNVVNGPNSNYY128 pKa = 9.28PLHH131 pKa = 6.33NFAYY135 pKa = 10.07GLYY138 pKa = 8.39STGGQFIPTIIEE150 pKa = 3.96DD151 pKa = 4.47FKK153 pKa = 11.63ADD155 pKa = 3.46TNTVVWQYY163 pKa = 11.37RR164 pKa = 11.84LSDD167 pKa = 3.69VVGKK171 pKa = 9.86EE172 pKa = 3.38IAFIAFDD179 pKa = 4.35PNGSNVFTLEE189 pKa = 3.85VDD191 pKa = 4.23GVQYY195 pKa = 10.87AQEE198 pKa = 4.3GYY200 pKa = 9.79IYY202 pKa = 11.01VFGSQSADD210 pKa = 3.22VVKK213 pKa = 9.7TVIINQTLQQ222 pKa = 2.93
Molecular weight: 25.65 kDa
Isoelectric point according different methods:
Protein with the highest isoelectric point:
>tr|S0A3Q7|S0A3Q7_9VIRU Mannosyl-glycoprotein endo-beta-N-acetylglucosaminidase OS=Cellulophaga phage phi12a:1 OX=1327987 GN=Phi12a:1_pg8 PE=4 SV=1
MM1 pKa = 8.24RR2 pKa = 11.84ITNKK6 pKa = 9.86QLAVYY11 pKa = 9.26IGVSEE16 pKa = 4.2RR17 pKa = 11.84VVKK20 pKa = 10.41RR21 pKa = 11.84HH22 pKa = 4.98RR23 pKa = 11.84LYY25 pKa = 11.13YY26 pKa = 10.16ISCLQLKK33 pKa = 10.17RR34 pKa = 11.84NYY36 pKa = 8.49LTLYY40 pKa = 10.4DD41 pKa = 3.91ISRR44 pKa = 11.84LDD46 pKa = 3.53GVPVVVVARR55 pKa = 11.84IMGFPNSIINKK66 pKa = 8.61ISEE69 pKa = 4.31DD70 pKa = 3.36NGRR73 pKa = 3.65
MM1 pKa = 8.24RR2 pKa = 11.84ITNKK6 pKa = 9.86QLAVYY11 pKa = 9.26IGVSEE16 pKa = 4.2RR17 pKa = 11.84VVKK20 pKa = 10.41RR21 pKa = 11.84HH22 pKa = 4.98RR23 pKa = 11.84LYY25 pKa = 11.13YY26 pKa = 10.16ISCLQLKK33 pKa = 10.17RR34 pKa = 11.84NYY36 pKa = 8.49LTLYY40 pKa = 10.4DD41 pKa = 3.91ISRR44 pKa = 11.84LDD46 pKa = 3.53GVPVVVVARR55 pKa = 11.84IMGFPNSIINKK66 pKa = 8.61ISEE69 pKa = 4.31DD70 pKa = 3.36NGRR73 pKa = 3.65
Molecular weight: 8.47 kDa
Isoelectric point according different methods:
Peptides (in silico digests for buttom-up proteomics)
Below you can find in silico digests of the whole proteome with Trypsin, Chymotrypsin, Trypsin+LysC, LysN, ArgC proteases suitable for different mass spec machines.| Try ESI |
 |
|---|
| ChTry ESI |
 |
|---|
| ArgC ESI |
 |
|---|
| LysN ESI |
 |
|---|
| TryLysC ESI |
 |
|---|
| Try MALDI |
 |
|---|
| ChTry MALDI |
 |
|---|
| ArgC MALDI |
 |
|---|
| LysN MALDI |
 |
|---|
| TryLysC MALDI |
 |
|---|
| Try LTQ |
 |
|---|
| ChTry LTQ |
 |
|---|
| ArgC LTQ |
 |
|---|
| LysN LTQ |
 |
|---|
| TryLysC LTQ |
 |
|---|
| Try MSlow |
 |
|---|
| ChTry MSlow |
 |
|---|
| ArgC MSlow |
 |
|---|
| LysN MSlow |
 |
|---|
| TryLysC MSlow |
 |
|---|
| Try MShigh |
 |
|---|
| ChTry MShigh |
 |
|---|
| ArgC MShigh |
 |
|---|
| LysN MShigh |
 |
|---|
| TryLysC MShigh |
 |
|---|
General Statistics
Number of major isoforms |
Number of additional isoforms |
Number of all proteins |
Number of amino acids |
Min. Seq. Length |
Max. Seq. Length |
Avg. Seq. Length |
Avg. Mol. Weight |
|---|---|---|---|---|---|---|---|
0 |
1997 |
40 |
378 |
153.6 |
17.58 |
Amino acid frequency
Ala |
Cys |
Asp |
Glu |
Phe |
Gly |
His |
Ile |
Lys |
Leu |
|---|---|---|---|---|---|---|---|---|---|
5.208 ± 0.745 | 1.052 ± 0.321 |
4.457 ± 0.452 | 4.607 ± 0.588 |
5.608 ± 0.966 | 5.709 ± 0.653 |
1.703 ± 0.481 | 7.712 ± 0.549 |
9.214 ± 1.019 | 9.664 ± 0.593 |
Met |
Asn |
Gln |
Pro |
Arg |
Ser |
Thr |
Val |
Trp |
Tyr |
|---|---|---|---|---|---|---|---|---|---|
2.354 ± 0.313 | 6.86 ± 0.545 |
2.303 ± 0.268 | 3.605 ± 0.507 |
4.206 ± 0.485 | 6.96 ± 0.4 |
6.159 ± 0.461 | 6.81 ± 0.689 |
1.352 ± 0.365 | 4.457 ± 0.481 |
Most of the basic statistics you can see at this page can be downloaded from this CSV file
Proteome-pI is available under Creative Commons Attribution-NoDerivs license, for more details see here
| Reference: Kozlowski LP. Proteome-pI 2.0: Proteome Isoelectric Point Database Update. Nucleic Acids Res. 2021, doi: 10.1093/nar/gkab944 | Contact: Lukasz P. Kozlowski |
