Fig mosaic emaravirus
Taxonomy: Viruses; Riboviria; Orthornavirae; Negarnaviricota; Polyploviricotina; Ellioviricetes; Bunyavirales; Fimoviridae; Emaravirus
Average proteome isoelectric point is 6.04
Get precalculated fractions of proteins

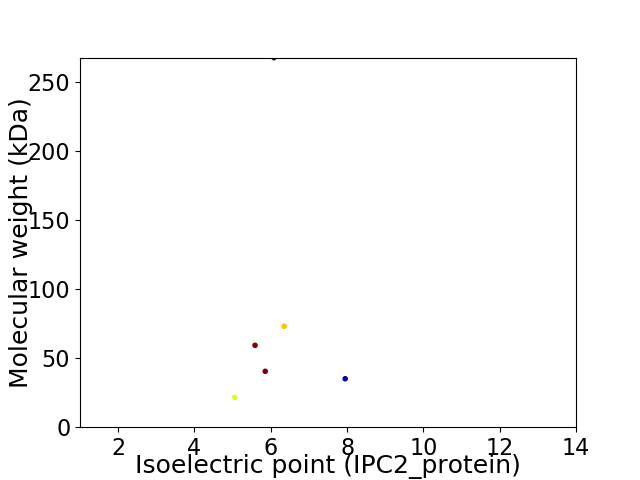
Virtual 2D-PAGE plot for 6 proteins (isoelectric point calculated using IPC2_protein)
Get csv file with sequences according to given criteria:
* You can choose from 21 different methods for calculating isoelectric point
Summary statistics related to proteome-wise predictions


Protein with the lowest isoelectric point:
>tr|I2GAD5|I2GAD5_9VIRU p6 protein OS=Fig mosaic emaravirus OX=1980427 GN=RNA6 PE=4 SV=1
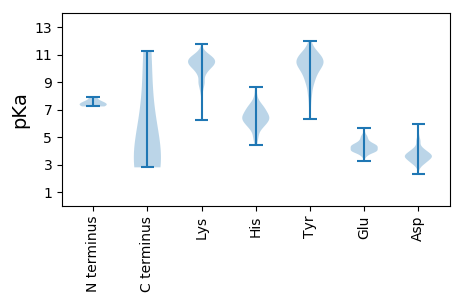
MM1 pKa = 7.35MMRR4 pKa = 11.84AFEE7 pKa = 4.38TIYY10 pKa = 10.43NVCIARR16 pKa = 11.84DD17 pKa = 3.75LDD19 pKa = 3.94SLHH22 pKa = 8.17DD23 pKa = 3.88EE24 pKa = 4.36MEE26 pKa = 4.88CYY28 pKa = 10.46LFNAVADD35 pKa = 4.92KK36 pKa = 10.35IDD38 pKa = 3.42NMEE41 pKa = 4.38SYY43 pKa = 11.22SEE45 pKa = 4.02FLAMRR50 pKa = 11.84DD51 pKa = 3.24AYY53 pKa = 10.62FDD55 pKa = 3.94KK56 pKa = 10.86KK57 pKa = 11.24LDD59 pKa = 3.51MSKK62 pKa = 10.61FNSTIPHH69 pKa = 5.57VSVEE73 pKa = 4.21GCNVSQKK80 pKa = 9.79VIRR83 pKa = 11.84YY84 pKa = 6.83FMRR87 pKa = 11.84YY88 pKa = 6.4VQIVSSLFGSCNILDD103 pKa = 4.36GNLSQDD109 pKa = 3.17FHH111 pKa = 8.52LFGTNVIGNSVSPVIPDD128 pKa = 3.19NSKK131 pKa = 10.26YY132 pKa = 11.24LLMKK136 pKa = 9.02PTDD139 pKa = 3.66VQDD142 pKa = 4.04LVWAVVIGKK151 pKa = 9.64DD152 pKa = 3.82PIEE155 pKa = 4.18TLRR158 pKa = 11.84KK159 pKa = 9.8SQFLQNKK166 pKa = 7.52VATIPTVSEE175 pKa = 4.08EE176 pKa = 4.9LSFLYY181 pKa = 9.8QQYY184 pKa = 10.25HH185 pKa = 6.5ISHH188 pKa = 7.25
MM1 pKa = 7.35MMRR4 pKa = 11.84AFEE7 pKa = 4.38TIYY10 pKa = 10.43NVCIARR16 pKa = 11.84DD17 pKa = 3.75LDD19 pKa = 3.94SLHH22 pKa = 8.17DD23 pKa = 3.88EE24 pKa = 4.36MEE26 pKa = 4.88CYY28 pKa = 10.46LFNAVADD35 pKa = 4.92KK36 pKa = 10.35IDD38 pKa = 3.42NMEE41 pKa = 4.38SYY43 pKa = 11.22SEE45 pKa = 4.02FLAMRR50 pKa = 11.84DD51 pKa = 3.24AYY53 pKa = 10.62FDD55 pKa = 3.94KK56 pKa = 10.86KK57 pKa = 11.24LDD59 pKa = 3.51MSKK62 pKa = 10.61FNSTIPHH69 pKa = 5.57VSVEE73 pKa = 4.21GCNVSQKK80 pKa = 9.79VIRR83 pKa = 11.84YY84 pKa = 6.83FMRR87 pKa = 11.84YY88 pKa = 6.4VQIVSSLFGSCNILDD103 pKa = 4.36GNLSQDD109 pKa = 3.17FHH111 pKa = 8.52LFGTNVIGNSVSPVIPDD128 pKa = 3.19NSKK131 pKa = 10.26YY132 pKa = 11.24LLMKK136 pKa = 9.02PTDD139 pKa = 3.66VQDD142 pKa = 4.04LVWAVVIGKK151 pKa = 9.64DD152 pKa = 3.82PIEE155 pKa = 4.18TLRR158 pKa = 11.84KK159 pKa = 9.8SQFLQNKK166 pKa = 7.52VATIPTVSEE175 pKa = 4.08EE176 pKa = 4.9LSFLYY181 pKa = 9.8QQYY184 pKa = 10.25HH185 pKa = 6.5ISHH188 pKa = 7.25
Molecular weight: 21.58 kDa
Isoelectric point according different methods:
Protein with the highest isoelectric point:
>tr|C8Z2H2|C8Z2H2_9VIRU Putative movement protein OS=Fig mosaic emaravirus OX=1980427 GN=RNA4 PE=2 SV=1
MM1 pKa = 7.52APKK4 pKa = 10.48SKK6 pKa = 7.72TTSASSSKK14 pKa = 8.81ITPGQMQEE22 pKa = 3.97NTVLLSSGSKK32 pKa = 10.34LKK34 pKa = 10.64AIKK37 pKa = 8.71LTNVVNGKK45 pKa = 8.44LTHH48 pKa = 7.18PEE50 pKa = 3.87TSDD53 pKa = 3.32LKK55 pKa = 10.83PIDD58 pKa = 3.97VEE60 pKa = 4.5VQAFTSASQNISNFTLHH77 pKa = 7.36KK78 pKa = 9.92YY79 pKa = 10.69RR80 pKa = 11.84NICHH84 pKa = 6.64VDD86 pKa = 3.03TCAAHH91 pKa = 6.7LSKK94 pKa = 10.95SKK96 pKa = 10.35EE97 pKa = 3.94IKK99 pKa = 10.2EE100 pKa = 3.9KK101 pKa = 10.63LQARR105 pKa = 11.84NLRR108 pKa = 11.84LIVSSNEE115 pKa = 3.24FLVVVKK121 pKa = 9.75EE122 pKa = 4.45LNDD125 pKa = 3.57STVDD129 pKa = 3.46NVVSFNKK136 pKa = 10.14ACAIMSAGILKK147 pKa = 8.9HH148 pKa = 5.71TFDD151 pKa = 5.81EE152 pKa = 4.44EE153 pKa = 4.41FDD155 pKa = 3.72WKK157 pKa = 10.59LSKK160 pKa = 10.55YY161 pKa = 10.63VKK163 pKa = 9.75TNNTTKK169 pKa = 10.59VIPDD173 pKa = 3.1VKK175 pKa = 10.24IINRR179 pKa = 11.84LAGQMGLSAGNPYY192 pKa = 10.72YY193 pKa = 10.44WMIVPGYY200 pKa = 8.6EE201 pKa = 4.21FLYY204 pKa = 10.04EE205 pKa = 4.26LYY207 pKa = 9.64PAEE210 pKa = 4.09VLAYY214 pKa = 9.05TLVRR218 pKa = 11.84LQYY221 pKa = 10.38RR222 pKa = 11.84KK223 pKa = 10.08NLNIPDD229 pKa = 4.09SMTDD233 pKa = 3.11ADD235 pKa = 4.01IVSSLVMKK243 pKa = 9.43MNRR246 pKa = 11.84IHH248 pKa = 7.37KK249 pKa = 10.08LEE251 pKa = 3.85QTSFDD256 pKa = 3.66EE257 pKa = 4.47ALNLIGKK264 pKa = 9.61DD265 pKa = 3.69NVSEE269 pKa = 4.58AYY271 pKa = 10.5VEE273 pKa = 3.99LARR276 pKa = 11.84DD277 pKa = 3.33IGSTSKK283 pKa = 9.71TKK285 pKa = 10.84RR286 pKa = 11.84NDD288 pKa = 3.05EE289 pKa = 4.78AILKK293 pKa = 9.56FKK295 pKa = 10.61EE296 pKa = 4.52LIASFLPALEE306 pKa = 4.32ADD308 pKa = 5.16RR309 pKa = 11.84IASAHH314 pKa = 4.4VV315 pKa = 3.04
MM1 pKa = 7.52APKK4 pKa = 10.48SKK6 pKa = 7.72TTSASSSKK14 pKa = 8.81ITPGQMQEE22 pKa = 3.97NTVLLSSGSKK32 pKa = 10.34LKK34 pKa = 10.64AIKK37 pKa = 8.71LTNVVNGKK45 pKa = 8.44LTHH48 pKa = 7.18PEE50 pKa = 3.87TSDD53 pKa = 3.32LKK55 pKa = 10.83PIDD58 pKa = 3.97VEE60 pKa = 4.5VQAFTSASQNISNFTLHH77 pKa = 7.36KK78 pKa = 9.92YY79 pKa = 10.69RR80 pKa = 11.84NICHH84 pKa = 6.64VDD86 pKa = 3.03TCAAHH91 pKa = 6.7LSKK94 pKa = 10.95SKK96 pKa = 10.35EE97 pKa = 3.94IKK99 pKa = 10.2EE100 pKa = 3.9KK101 pKa = 10.63LQARR105 pKa = 11.84NLRR108 pKa = 11.84LIVSSNEE115 pKa = 3.24FLVVVKK121 pKa = 9.75EE122 pKa = 4.45LNDD125 pKa = 3.57STVDD129 pKa = 3.46NVVSFNKK136 pKa = 10.14ACAIMSAGILKK147 pKa = 8.9HH148 pKa = 5.71TFDD151 pKa = 5.81EE152 pKa = 4.44EE153 pKa = 4.41FDD155 pKa = 3.72WKK157 pKa = 10.59LSKK160 pKa = 10.55YY161 pKa = 10.63VKK163 pKa = 9.75TNNTTKK169 pKa = 10.59VIPDD173 pKa = 3.1VKK175 pKa = 10.24IINRR179 pKa = 11.84LAGQMGLSAGNPYY192 pKa = 10.72YY193 pKa = 10.44WMIVPGYY200 pKa = 8.6EE201 pKa = 4.21FLYY204 pKa = 10.04EE205 pKa = 4.26LYY207 pKa = 9.64PAEE210 pKa = 4.09VLAYY214 pKa = 9.05TLVRR218 pKa = 11.84LQYY221 pKa = 10.38RR222 pKa = 11.84KK223 pKa = 10.08NLNIPDD229 pKa = 4.09SMTDD233 pKa = 3.11ADD235 pKa = 4.01IVSSLVMKK243 pKa = 9.43MNRR246 pKa = 11.84IHH248 pKa = 7.37KK249 pKa = 10.08LEE251 pKa = 3.85QTSFDD256 pKa = 3.66EE257 pKa = 4.47ALNLIGKK264 pKa = 9.61DD265 pKa = 3.69NVSEE269 pKa = 4.58AYY271 pKa = 10.5VEE273 pKa = 3.99LARR276 pKa = 11.84DD277 pKa = 3.33IGSTSKK283 pKa = 9.71TKK285 pKa = 10.84RR286 pKa = 11.84NDD288 pKa = 3.05EE289 pKa = 4.78AILKK293 pKa = 9.56FKK295 pKa = 10.61EE296 pKa = 4.52LIASFLPALEE306 pKa = 4.32ADD308 pKa = 5.16RR309 pKa = 11.84IASAHH314 pKa = 4.4VV315 pKa = 3.04
Molecular weight: 35.14 kDa
Isoelectric point according different methods:
Peptides (in silico digests for buttom-up proteomics)
Below you can find in silico digests of the whole proteome with Trypsin, Chymotrypsin, Trypsin+LysC, LysN, ArgC proteases suitable for different mass spec machines.| Try ESI |
 |
|---|
| ChTry ESI |
 |
|---|
| ArgC ESI |
 |
|---|
| LysN ESI |
 |
|---|
| TryLysC ESI |
 |
|---|
| Try MALDI |
 |
|---|
| ChTry MALDI |
 |
|---|
| ArgC MALDI |
 |
|---|
| LysN MALDI |
 |
|---|
| TryLysC MALDI |
 |
|---|
| Try LTQ |
 |
|---|
| ChTry LTQ |
 |
|---|
| ArgC LTQ |
 |
|---|
| LysN LTQ |
 |
|---|
| TryLysC LTQ |
 |
|---|
| Try MSlow |
 |
|---|
| ChTry MSlow |
 |
|---|
| ArgC MSlow |
 |
|---|
| LysN MSlow |
 |
|---|
| TryLysC MSlow |
 |
|---|
| Try MShigh |
 |
|---|
| ChTry MShigh |
 |
|---|
| ArgC MShigh |
 |
|---|
| LysN MShigh |
 |
|---|
| TryLysC MShigh |
 |
|---|
General Statistics
Number of major isoforms |
Number of additional isoforms |
Number of all proteins |
Number of amino acids |
Min. Seq. Length |
Max. Seq. Length |
Avg. Seq. Length |
Avg. Mol. Weight |
|---|---|---|---|---|---|---|---|
0 |
4304 |
188 |
2297 |
717.3 |
82.96 |
Amino acid frequency
Ala |
Cys |
Asp |
Glu |
Phe |
Gly |
His |
Ile |
Lys |
Leu |
|---|---|---|---|---|---|---|---|---|---|
3.88 ± 0.768 | 1.905 ± 0.463 |
6.808 ± 0.475 | 5.832 ± 0.175 |
4.345 ± 0.343 | 3.415 ± 0.381 |
2.463 ± 0.276 | 9.41 ± 0.6 |
8.434 ± 0.212 | 9.038 ± 0.699 |
Met |
Asn |
Gln |
Pro |
Arg |
Ser |
Thr |
Val |
Trp |
Tyr |
|---|---|---|---|---|---|---|---|---|---|
2.672 ± 0.273 | 6.761 ± 0.499 |
3.067 ± 0.082 | 2.718 ± 0.201 |
3.485 ± 0.427 | 7.644 ± 0.419 |
6.064 ± 0.495 | 5.599 ± 0.812 |
0.558 ± 0.243 | 5.901 ± 0.957 |
Most of the basic statistics you can see at this page can be downloaded from this CSV file
Proteome-pI is available under Creative Commons Attribution-NoDerivs license, for more details see here
| Reference: Kozlowski LP. Proteome-pI 2.0: Proteome Isoelectric Point Database Update. Nucleic Acids Res. 2021, doi: 10.1093/nar/gkab944 | Contact: Lukasz P. Kozlowski |
