Subterranean clover mottle virus
Taxonomy: Viruses; Riboviria; Orthornavirae; Pisuviricota; Pisoniviricetes; Sobelivirales; Solemoviridae; Sobemovirus
Average proteome isoelectric point is 6.73
Get precalculated fractions of proteins

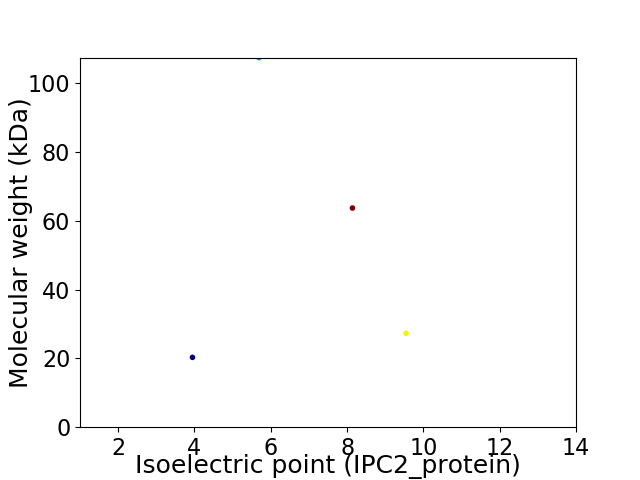
Virtual 2D-PAGE plot for 4 proteins (isoelectric point calculated using IPC2_protein)
Get csv file with sequences according to given criteria:
* You can choose from 21 different methods for calculating isoelectric point
Summary statistics related to proteome-wise predictions


Protein with the lowest isoelectric point:
>tr|Q8BEQ3|Q8BEQ3_9VIRU ORF1 OS=Subterranean clover mottle virus OX=12472 PE=4 SV=1
MM1 pKa = 7.61PSVSIEE7 pKa = 4.02VYY9 pKa = 9.93SRR11 pKa = 11.84EE12 pKa = 4.11RR13 pKa = 11.84PTLLLLTHH21 pKa = 6.95RR22 pKa = 11.84FWPSSEE28 pKa = 4.18TIPRR32 pKa = 11.84DD33 pKa = 3.39YY34 pKa = 10.95EE35 pKa = 3.87YY36 pKa = 11.05DD37 pKa = 3.5QTVTLYY43 pKa = 11.04GRR45 pKa = 11.84FNNEE49 pKa = 3.46EE50 pKa = 3.99EE51 pKa = 4.22TLILCISRR59 pKa = 11.84CNTCDD64 pKa = 3.68FWCVLGDD71 pKa = 3.8SNLPGIEE78 pKa = 3.88IWDD81 pKa = 3.81SALSCFANAEE91 pKa = 4.17DD92 pKa = 4.54CTLSGQCSACRR103 pKa = 11.84NPPVEE108 pKa = 4.54EE109 pKa = 4.86DD110 pKa = 3.53ADD112 pKa = 3.92SDD114 pKa = 4.28SSEE117 pKa = 4.54EE118 pKa = 3.99YY119 pKa = 10.17QSLGNRR125 pKa = 11.84TVIRR129 pKa = 11.84DD130 pKa = 3.92SGPEE134 pKa = 4.38GYY136 pKa = 9.43WSEE139 pKa = 4.25SSDD142 pKa = 5.2DD143 pKa = 3.86EE144 pKa = 4.45DD145 pKa = 3.5HH146 pKa = 6.66TRR148 pKa = 11.84AAYY151 pKa = 10.0SPCDD155 pKa = 3.49YY156 pKa = 10.73EE157 pKa = 5.04GNLVRR162 pKa = 11.84LFQLQSIQPLQEE174 pKa = 5.04GDD176 pKa = 3.66DD177 pKa = 3.81QEE179 pKa = 4.29
MM1 pKa = 7.61PSVSIEE7 pKa = 4.02VYY9 pKa = 9.93SRR11 pKa = 11.84EE12 pKa = 4.11RR13 pKa = 11.84PTLLLLTHH21 pKa = 6.95RR22 pKa = 11.84FWPSSEE28 pKa = 4.18TIPRR32 pKa = 11.84DD33 pKa = 3.39YY34 pKa = 10.95EE35 pKa = 3.87YY36 pKa = 11.05DD37 pKa = 3.5QTVTLYY43 pKa = 11.04GRR45 pKa = 11.84FNNEE49 pKa = 3.46EE50 pKa = 3.99EE51 pKa = 4.22TLILCISRR59 pKa = 11.84CNTCDD64 pKa = 3.68FWCVLGDD71 pKa = 3.8SNLPGIEE78 pKa = 3.88IWDD81 pKa = 3.81SALSCFANAEE91 pKa = 4.17DD92 pKa = 4.54CTLSGQCSACRR103 pKa = 11.84NPPVEE108 pKa = 4.54EE109 pKa = 4.86DD110 pKa = 3.53ADD112 pKa = 3.92SDD114 pKa = 4.28SSEE117 pKa = 4.54EE118 pKa = 3.99YY119 pKa = 10.17QSLGNRR125 pKa = 11.84TVIRR129 pKa = 11.84DD130 pKa = 3.92SGPEE134 pKa = 4.38GYY136 pKa = 9.43WSEE139 pKa = 4.25SSDD142 pKa = 5.2DD143 pKa = 3.86EE144 pKa = 4.45DD145 pKa = 3.5HH146 pKa = 6.66TRR148 pKa = 11.84AAYY151 pKa = 10.0SPCDD155 pKa = 3.49YY156 pKa = 10.73EE157 pKa = 5.04GNLVRR162 pKa = 11.84LFQLQSIQPLQEE174 pKa = 5.04GDD176 pKa = 3.66DD177 pKa = 3.81QEE179 pKa = 4.29
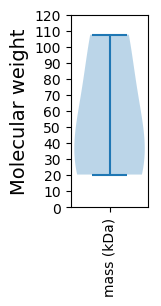
Molecular weight: 20.32 kDa
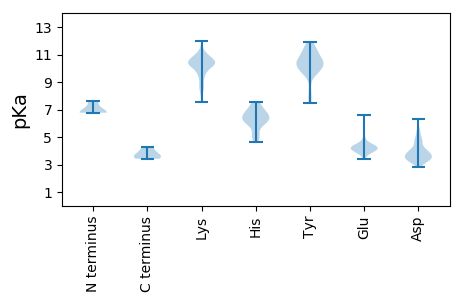
Isoelectric point according different methods:
Protein with the highest isoelectric point:
>tr|Q8BEQ1|Q8BEQ1_9VIRU N-terminal protein OS=Subterranean clover mottle virus OX=12472 PE=4 SV=1
MM1 pKa = 6.82TGRR4 pKa = 11.84RR5 pKa = 11.84VRR7 pKa = 11.84RR8 pKa = 11.84SKK10 pKa = 10.76KK11 pKa = 9.99KK12 pKa = 10.09SGQEE16 pKa = 3.42TTTQQNRR23 pKa = 11.84QRR25 pKa = 11.84SGGKK29 pKa = 8.99QSQNQMIQVKK39 pKa = 9.55RR40 pKa = 11.84EE41 pKa = 3.99RR42 pKa = 11.84TPMASTVVIGRR53 pKa = 11.84SFPAIHH59 pKa = 6.68SEE61 pKa = 4.03GTRR64 pKa = 11.84TRR66 pKa = 11.84VCHH69 pKa = 6.24TEE71 pKa = 4.39LIRR74 pKa = 11.84AVDD77 pKa = 3.21INTIFTLNFTWCIPSAFPWLSGVAVNWSKK106 pKa = 10.38WRR108 pKa = 11.84WVSLRR113 pKa = 11.84FTYY116 pKa = 9.9MPAAATTTQGTVALGYY132 pKa = 10.73LYY134 pKa = 10.62DD135 pKa = 4.71ALDD138 pKa = 4.13AVPAALQQMSSLAGFSTGAVWSGSEE163 pKa = 4.08GSVLLRR169 pKa = 11.84AANKK173 pKa = 9.88NGNVPGAVSSQLNIADD189 pKa = 3.4PSKK192 pKa = 10.26YY193 pKa = 10.14YY194 pKa = 10.4RR195 pKa = 11.84YY196 pKa = 10.5EE197 pKa = 3.75NLTNFAAIAEE207 pKa = 4.58GTKK210 pKa = 10.52NLYY213 pKa = 10.45APARR217 pKa = 11.84LAVAAANGAADD228 pKa = 3.64VGGVGTVYY236 pKa = 9.77ATYY239 pKa = 10.37VVEE242 pKa = 5.54LIDD245 pKa = 5.24PISSALNSS253 pKa = 3.57
MM1 pKa = 6.82TGRR4 pKa = 11.84RR5 pKa = 11.84VRR7 pKa = 11.84RR8 pKa = 11.84SKK10 pKa = 10.76KK11 pKa = 9.99KK12 pKa = 10.09SGQEE16 pKa = 3.42TTTQQNRR23 pKa = 11.84QRR25 pKa = 11.84SGGKK29 pKa = 8.99QSQNQMIQVKK39 pKa = 9.55RR40 pKa = 11.84EE41 pKa = 3.99RR42 pKa = 11.84TPMASTVVIGRR53 pKa = 11.84SFPAIHH59 pKa = 6.68SEE61 pKa = 4.03GTRR64 pKa = 11.84TRR66 pKa = 11.84VCHH69 pKa = 6.24TEE71 pKa = 4.39LIRR74 pKa = 11.84AVDD77 pKa = 3.21INTIFTLNFTWCIPSAFPWLSGVAVNWSKK106 pKa = 10.38WRR108 pKa = 11.84WVSLRR113 pKa = 11.84FTYY116 pKa = 9.9MPAAATTTQGTVALGYY132 pKa = 10.73LYY134 pKa = 10.62DD135 pKa = 4.71ALDD138 pKa = 4.13AVPAALQQMSSLAGFSTGAVWSGSEE163 pKa = 4.08GSVLLRR169 pKa = 11.84AANKK173 pKa = 9.88NGNVPGAVSSQLNIADD189 pKa = 3.4PSKK192 pKa = 10.26YY193 pKa = 10.14YY194 pKa = 10.4RR195 pKa = 11.84YY196 pKa = 10.5EE197 pKa = 3.75NLTNFAAIAEE207 pKa = 4.58GTKK210 pKa = 10.52NLYY213 pKa = 10.45APARR217 pKa = 11.84LAVAAANGAADD228 pKa = 3.64VGGVGTVYY236 pKa = 9.77ATYY239 pKa = 10.37VVEE242 pKa = 5.54LIDD245 pKa = 5.24PISSALNSS253 pKa = 3.57
Molecular weight: 27.3 kDa
Isoelectric point according different methods:
Peptides (in silico digests for buttom-up proteomics)
Below you can find in silico digests of the whole proteome with Trypsin, Chymotrypsin, Trypsin+LysC, LysN, ArgC proteases suitable for different mass spec machines.| Try ESI |
 |
|---|
| ChTry ESI |
 |
|---|
| ArgC ESI |
 |
|---|
| LysN ESI |
 |
|---|
| TryLysC ESI |
 |
|---|
| Try MALDI |
 |
|---|
| ChTry MALDI |
 |
|---|
| ArgC MALDI |
 |
|---|
| LysN MALDI |
 |
|---|
| TryLysC MALDI |
 |
|---|
| Try LTQ |
 |
|---|
| ChTry LTQ |
 |
|---|
| ArgC LTQ |
 |
|---|
| LysN LTQ |
 |
|---|
| TryLysC LTQ |
 |
|---|
| Try MSlow |
 |
|---|
| ChTry MSlow |
 |
|---|
| ArgC MSlow |
 |
|---|
| LysN MSlow |
 |
|---|
| TryLysC MSlow |
 |
|---|
| Try MShigh |
 |
|---|
| ChTry MShigh |
 |
|---|
| ArgC MShigh |
 |
|---|
| LysN MShigh |
 |
|---|
| TryLysC MShigh |
 |
|---|
General Statistics
Number of major isoforms |
Number of additional isoforms |
Number of all proteins |
Number of amino acids |
Min. Seq. Length |
Max. Seq. Length |
Avg. Seq. Length |
Avg. Mol. Weight |
|---|---|---|---|---|---|---|---|
0 |
1978 |
179 |
966 |
494.5 |
54.73 |
Amino acid frequency
Ala |
Cys |
Asp |
Glu |
Phe |
Gly |
His |
Ile |
Lys |
Leu |
|---|---|---|---|---|---|---|---|---|---|
7.128 ± 0.954 | 1.871 ± 0.501 |
5.612 ± 0.643 | 6.775 ± 0.876 |
3.286 ± 0.282 | 7.381 ± 0.357 |
1.82 ± 0.254 | 4.601 ± 0.338 |
6.37 ± 1.299 | 9.454 ± 0.587 |
Met |
Asn |
Gln |
Pro |
Arg |
Ser |
Thr |
Val |
Trp |
Tyr |
|---|---|---|---|---|---|---|---|---|---|
1.618 ± 0.148 | 3.539 ± 0.446 |
5.157 ± 0.217 | 2.932 ± 0.539 |
5.207 ± 0.37 | 9.505 ± 0.943 |
5.308 ± 0.816 | 7.28 ± 0.607 |
2.123 ± 0.171 | 3.033 ± 0.323 |
Most of the basic statistics you can see at this page can be downloaded from this CSV file
Proteome-pI is available under Creative Commons Attribution-NoDerivs license, for more details see here
| Reference: Kozlowski LP. Proteome-pI 2.0: Proteome Isoelectric Point Database Update. Nucleic Acids Res. 2021, doi: 10.1093/nar/gkab944 | Contact: Lukasz P. Kozlowski |
