Flanders hapavirus
Taxonomy: Viruses; Riboviria; Orthornavirae; Negarnaviricota; Haploviricotina; Monjiviricetes; Mononegavirales; Rhabdoviridae; Alpharhabdovirinae; Hapavirus
Average proteome isoelectric point is 6.77
Get precalculated fractions of proteins

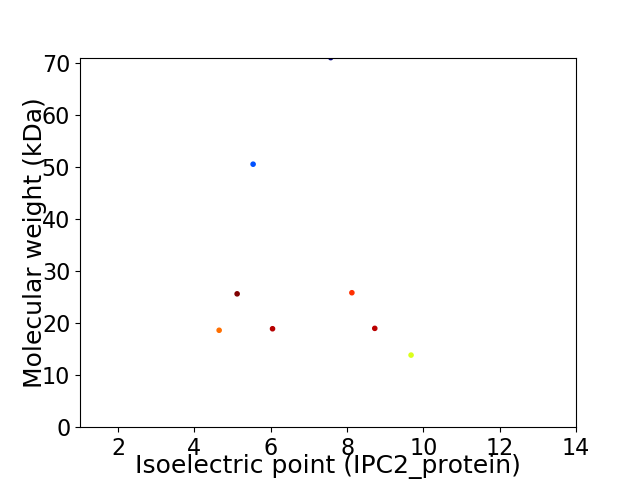
Virtual 2D-PAGE plot for 8 proteins (isoelectric point calculated using IPC2_protein)
Get csv file with sequences according to given criteria:
* You can choose from 21 different methods for calculating isoelectric point
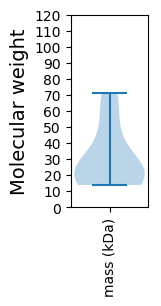
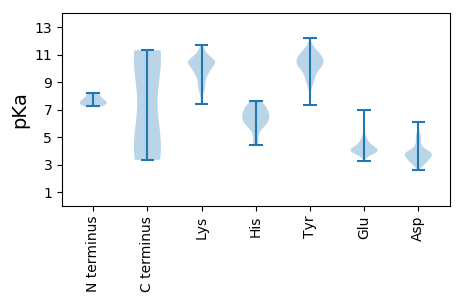
Summary statistics related to proteome-wise predictions


Protein with the lowest isoelectric point:
>tr|A0A077CZE0|A0A077CZE0_9RHAB SH protein OS=Flanders hapavirus OX=1972612 PE=4 SV=1
MM1 pKa = 7.99DD2 pKa = 5.42LYY4 pKa = 10.74INIGITFHH12 pKa = 6.52YY13 pKa = 9.87NNSYY17 pKa = 10.84LDD19 pKa = 3.79NDD21 pKa = 3.93SLNWIISRR29 pKa = 11.84MIYY32 pKa = 10.41DD33 pKa = 4.42CVRR36 pKa = 11.84EE37 pKa = 4.06SGIPGDD43 pKa = 3.77VAAFAINMAWEE54 pKa = 4.3HH55 pKa = 6.04VDD57 pKa = 3.91ISFDD61 pKa = 3.54SDD63 pKa = 3.95KK64 pKa = 10.32ITHH67 pKa = 6.69GYY69 pKa = 9.76CWLQEE74 pKa = 4.02AVSLPGTPKK83 pKa = 10.94DD84 pKa = 3.96LDD86 pKa = 3.63KK87 pKa = 11.71LNNTFSSRR95 pKa = 11.84GNFFIQGDD103 pKa = 3.78EE104 pKa = 3.93ALGEE108 pKa = 4.05VEE110 pKa = 4.55YY111 pKa = 11.19VFFVAEE117 pKa = 4.04PTLQEE122 pKa = 3.82GRR124 pKa = 11.84PWNMLWHH131 pKa = 7.16PIFVDD136 pKa = 3.77PQAYY140 pKa = 8.81HH141 pKa = 6.25VKK143 pKa = 10.44RR144 pKa = 11.84NPDD147 pKa = 2.83VVAYY151 pKa = 9.81KK152 pKa = 10.56FGFQHH157 pKa = 7.53LIYY160 pKa = 10.22PP161 pKa = 4.71
MM1 pKa = 7.99DD2 pKa = 5.42LYY4 pKa = 10.74INIGITFHH12 pKa = 6.52YY13 pKa = 9.87NNSYY17 pKa = 10.84LDD19 pKa = 3.79NDD21 pKa = 3.93SLNWIISRR29 pKa = 11.84MIYY32 pKa = 10.41DD33 pKa = 4.42CVRR36 pKa = 11.84EE37 pKa = 4.06SGIPGDD43 pKa = 3.77VAAFAINMAWEE54 pKa = 4.3HH55 pKa = 6.04VDD57 pKa = 3.91ISFDD61 pKa = 3.54SDD63 pKa = 3.95KK64 pKa = 10.32ITHH67 pKa = 6.69GYY69 pKa = 9.76CWLQEE74 pKa = 4.02AVSLPGTPKK83 pKa = 10.94DD84 pKa = 3.96LDD86 pKa = 3.63KK87 pKa = 11.71LNNTFSSRR95 pKa = 11.84GNFFIQGDD103 pKa = 3.78EE104 pKa = 3.93ALGEE108 pKa = 4.05VEE110 pKa = 4.55YY111 pKa = 11.19VFFVAEE117 pKa = 4.04PTLQEE122 pKa = 3.82GRR124 pKa = 11.84PWNMLWHH131 pKa = 7.16PIFVDD136 pKa = 3.77PQAYY140 pKa = 8.81HH141 pKa = 6.25VKK143 pKa = 10.44RR144 pKa = 11.84NPDD147 pKa = 2.83VVAYY151 pKa = 9.81KK152 pKa = 10.56FGFQHH157 pKa = 7.53LIYY160 pKa = 10.22PP161 pKa = 4.71
Molecular weight: 18.62 kDa
Isoelectric point according different methods:
Protein with the highest isoelectric point:
>tr|T2FGJ3|T2FGJ3_9RHAB U2 OS=Flanders hapavirus OX=1972612 GN=U2 PE=4 SV=1
MM1 pKa = 7.37GFDD4 pKa = 3.03IGKK7 pKa = 10.11DD8 pKa = 2.6IGKK11 pKa = 8.87PLKK14 pKa = 10.23EE15 pKa = 4.27AFDD18 pKa = 4.2KK19 pKa = 11.12FGSDD23 pKa = 3.09IKK25 pKa = 10.51ITFLTVLNWMKK36 pKa = 10.06WISIGILIVISIILICKK53 pKa = 8.23IVKK56 pKa = 9.81VLFQFGKK63 pKa = 10.38CLWSGFKK70 pKa = 10.36CCRR73 pKa = 11.84KK74 pKa = 9.56CFKK77 pKa = 10.47SSKK80 pKa = 8.84TRR82 pKa = 11.84AKK84 pKa = 10.41SSKK87 pKa = 10.45EE88 pKa = 3.64KK89 pKa = 10.47IKK91 pKa = 10.81LKK93 pKa = 10.37RR94 pKa = 11.84ATKK97 pKa = 9.95MIRR100 pKa = 11.84NPLRR104 pKa = 11.84RR105 pKa = 11.84KK106 pKa = 9.27KK107 pKa = 10.7SRR109 pKa = 11.84IKK111 pKa = 10.4KK112 pKa = 8.1VPSVIKK118 pKa = 10.64LII120 pKa = 4.14
MM1 pKa = 7.37GFDD4 pKa = 3.03IGKK7 pKa = 10.11DD8 pKa = 2.6IGKK11 pKa = 8.87PLKK14 pKa = 10.23EE15 pKa = 4.27AFDD18 pKa = 4.2KK19 pKa = 11.12FGSDD23 pKa = 3.09IKK25 pKa = 10.51ITFLTVLNWMKK36 pKa = 10.06WISIGILIVISIILICKK53 pKa = 8.23IVKK56 pKa = 9.81VLFQFGKK63 pKa = 10.38CLWSGFKK70 pKa = 10.36CCRR73 pKa = 11.84KK74 pKa = 9.56CFKK77 pKa = 10.47SSKK80 pKa = 8.84TRR82 pKa = 11.84AKK84 pKa = 10.41SSKK87 pKa = 10.45EE88 pKa = 3.64KK89 pKa = 10.47IKK91 pKa = 10.81LKK93 pKa = 10.37RR94 pKa = 11.84ATKK97 pKa = 9.95MIRR100 pKa = 11.84NPLRR104 pKa = 11.84RR105 pKa = 11.84KK106 pKa = 9.27KK107 pKa = 10.7SRR109 pKa = 11.84IKK111 pKa = 10.4KK112 pKa = 8.1VPSVIKK118 pKa = 10.64LII120 pKa = 4.14
Molecular weight: 13.85 kDa
Isoelectric point according different methods:
Peptides (in silico digests for buttom-up proteomics)
Below you can find in silico digests of the whole proteome with Trypsin, Chymotrypsin, Trypsin+LysC, LysN, ArgC proteases suitable for different mass spec machines.| Try ESI |
 |
|---|
| ChTry ESI |
 |
|---|
| ArgC ESI |
 |
|---|
| LysN ESI |
 |
|---|
| TryLysC ESI |
 |
|---|
| Try MALDI |
 |
|---|
| ChTry MALDI |
 |
|---|
| ArgC MALDI |
 |
|---|
| LysN MALDI |
 |
|---|
| TryLysC MALDI |
 |
|---|
| Try LTQ |
 |
|---|
| ChTry LTQ |
 |
|---|
| ArgC LTQ |
 |
|---|
| LysN LTQ |
 |
|---|
| TryLysC LTQ |
 |
|---|
| Try MSlow |
 |
|---|
| ChTry MSlow |
 |
|---|
| ArgC MSlow |
 |
|---|
| LysN MSlow |
 |
|---|
| TryLysC MSlow |
 |
|---|
| Try MShigh |
 |
|---|
| ChTry MShigh |
 |
|---|
| ArgC MShigh |
 |
|---|
| LysN MShigh |
 |
|---|
| TryLysC MShigh |
 |
|---|
General Statistics
Number of major isoforms |
Number of additional isoforms |
Number of all proteins |
Number of amino acids |
Min. Seq. Length |
Max. Seq. Length |
Avg. Seq. Length |
Avg. Mol. Weight |
|---|---|---|---|---|---|---|---|
0 |
2119 |
120 |
618 |
264.9 |
30.41 |
Amino acid frequency
Ala |
Cys |
Asp |
Glu |
Phe |
Gly |
His |
Ile |
Lys |
Leu |
|---|---|---|---|---|---|---|---|---|---|
3.964 ± 0.763 | 1.888 ± 0.344 |
6.088 ± 0.641 | 5.286 ± 0.358 |
4.578 ± 0.523 | 5.663 ± 0.58 |
2.076 ± 0.316 | 7.881 ± 0.733 |
7.598 ± 1.063 | 8.495 ± 0.292 |
Met |
Asn |
Gln |
Pro |
Arg |
Ser |
Thr |
Val |
Trp |
Tyr |
|---|---|---|---|---|---|---|---|---|---|
2.548 ± 0.45 | 5.427 ± 0.482 |
4.908 ± 0.486 | 3.398 ± 0.309 |
4.483 ± 0.413 | 8.164 ± 0.829 |
5.05 ± 0.499 | 5.71 ± 0.572 |
1.935 ± 0.318 | 4.861 ± 0.645 |
Most of the basic statistics you can see at this page can be downloaded from this CSV file
Proteome-pI is available under Creative Commons Attribution-NoDerivs license, for more details see here
| Reference: Kozlowski LP. Proteome-pI 2.0: Proteome Isoelectric Point Database Update. Nucleic Acids Res. 2021, doi: 10.1093/nar/gkab944 | Contact: Lukasz P. Kozlowski |
