Clostridium saccharoperbutylacetonicum N1-4(HMT)
Taxonomy: cellular organisms; Bacteria; Terrabacteria group; Firmicutes; Clostridia; Eubacteriales; Clostridiaceae; Clostridium; Clostridium saccharoperbutylacetonicum; Clostridium saccharoperbutylacetonicum N1-4
Average proteome isoelectric point is 6.29
Get precalculated fractions of proteins

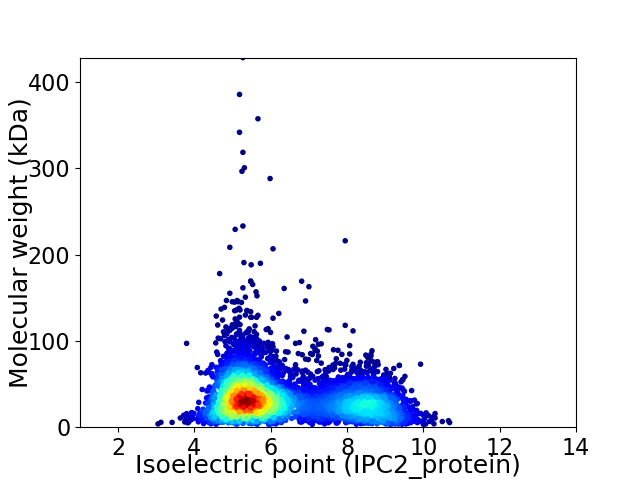
Virtual 2D-PAGE plot for 5810 proteins (isoelectric point calculated using IPC2_protein)
Get csv file with sequences according to given criteria:
* You can choose from 21 different methods for calculating isoelectric point
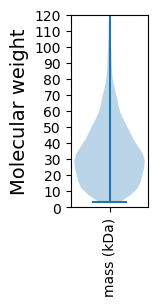
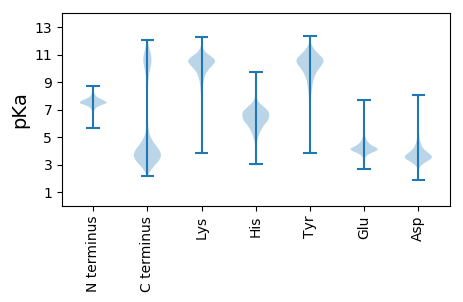
Summary statistics related to proteome-wise predictions


Protein with the lowest isoelectric point:
>tr|M1LYH0|M1LYH0_9CLOT Lipopolysaccharide biosynthesis protein OS=Clostridium saccharoperbutylacetonicum N1-4(HMT) OX=931276 GN=Cspa_c45520 PE=4 SV=1
MM1 pKa = 7.44KK2 pKa = 10.11SSEE5 pKa = 4.07IIEE8 pKa = 4.11YY9 pKa = 11.06LEE11 pKa = 5.19DD12 pKa = 3.8NDD14 pKa = 4.39LADD17 pKa = 4.35VEE19 pKa = 4.69EE20 pKa = 4.8IKK22 pKa = 10.85QKK24 pKa = 10.82SNYY27 pKa = 9.83VIIKK31 pKa = 9.57FYY33 pKa = 11.16YY34 pKa = 10.61DD35 pKa = 3.47FDD37 pKa = 4.17NEE39 pKa = 4.31EE40 pKa = 3.57ISAAKK45 pKa = 10.06AYY47 pKa = 8.97STEE50 pKa = 3.96EE51 pKa = 3.87SDD53 pKa = 5.79FEE55 pKa = 4.51PEE57 pKa = 3.21TDD59 pKa = 2.72EE60 pKa = 4.94WYY62 pKa = 10.27NEE64 pKa = 4.1CYY66 pKa = 10.01IPYY69 pKa = 9.99LRR71 pKa = 11.84DD72 pKa = 3.12IAVDD76 pKa = 3.6NVEE79 pKa = 4.65SIIDD83 pKa = 4.15EE84 pKa = 4.23ISDD87 pKa = 3.4EE88 pKa = 4.43LEE90 pKa = 3.98IEE92 pKa = 4.32GKK94 pKa = 10.2YY95 pKa = 10.2KK96 pKa = 10.38EE97 pKa = 4.25FGMEE101 pKa = 3.9NVEE104 pKa = 3.61NGYY107 pKa = 10.77YY108 pKa = 10.47KK109 pKa = 10.69FIAVFSDD116 pKa = 3.23EE117 pKa = 4.31LTDD120 pKa = 4.56EE121 pKa = 4.18EE122 pKa = 5.02MEE124 pKa = 4.84DD125 pKa = 4.39VLNDD129 pKa = 3.23YY130 pKa = 10.96HH131 pKa = 7.38KK132 pKa = 11.27
MM1 pKa = 7.44KK2 pKa = 10.11SSEE5 pKa = 4.07IIEE8 pKa = 4.11YY9 pKa = 11.06LEE11 pKa = 5.19DD12 pKa = 3.8NDD14 pKa = 4.39LADD17 pKa = 4.35VEE19 pKa = 4.69EE20 pKa = 4.8IKK22 pKa = 10.85QKK24 pKa = 10.82SNYY27 pKa = 9.83VIIKK31 pKa = 9.57FYY33 pKa = 11.16YY34 pKa = 10.61DD35 pKa = 3.47FDD37 pKa = 4.17NEE39 pKa = 4.31EE40 pKa = 3.57ISAAKK45 pKa = 10.06AYY47 pKa = 8.97STEE50 pKa = 3.96EE51 pKa = 3.87SDD53 pKa = 5.79FEE55 pKa = 4.51PEE57 pKa = 3.21TDD59 pKa = 2.72EE60 pKa = 4.94WYY62 pKa = 10.27NEE64 pKa = 4.1CYY66 pKa = 10.01IPYY69 pKa = 9.99LRR71 pKa = 11.84DD72 pKa = 3.12IAVDD76 pKa = 3.6NVEE79 pKa = 4.65SIIDD83 pKa = 4.15EE84 pKa = 4.23ISDD87 pKa = 3.4EE88 pKa = 4.43LEE90 pKa = 3.98IEE92 pKa = 4.32GKK94 pKa = 10.2YY95 pKa = 10.2KK96 pKa = 10.38EE97 pKa = 4.25FGMEE101 pKa = 3.9NVEE104 pKa = 3.61NGYY107 pKa = 10.77YY108 pKa = 10.47KK109 pKa = 10.69FIAVFSDD116 pKa = 3.23EE117 pKa = 4.31LTDD120 pKa = 4.56EE121 pKa = 4.18EE122 pKa = 5.02MEE124 pKa = 4.84DD125 pKa = 4.39VLNDD129 pKa = 3.23YY130 pKa = 10.96HH131 pKa = 7.38KK132 pKa = 11.27
Molecular weight: 15.71 kDa
Isoelectric point according different methods:
Protein with the highest isoelectric point:
>tr|M1M9L6|M1M9L6_9CLOT Glutamine transport ATP-binding protein GlnQ OS=Clostridium saccharoperbutylacetonicum N1-4(HMT) OX=931276 GN=glnQ1 PE=4 SV=1
MM1 pKa = 7.04NRR3 pKa = 11.84KK4 pKa = 8.49NNRR7 pKa = 11.84VIGAVSHH14 pKa = 6.54IVFPLATCVFLVWGFLFHH32 pKa = 6.88GWRR35 pKa = 11.84ICWIVYY41 pKa = 8.79PITGILFSAFARR53 pKa = 11.84TYY55 pKa = 11.46SLMNGANKK63 pKa = 10.25
MM1 pKa = 7.04NRR3 pKa = 11.84KK4 pKa = 8.49NNRR7 pKa = 11.84VIGAVSHH14 pKa = 6.54IVFPLATCVFLVWGFLFHH32 pKa = 6.88GWRR35 pKa = 11.84ICWIVYY41 pKa = 8.79PITGILFSAFARR53 pKa = 11.84TYY55 pKa = 11.46SLMNGANKK63 pKa = 10.25
Molecular weight: 7.22 kDa
Isoelectric point according different methods:
Peptides (in silico digests for buttom-up proteomics)
Below you can find in silico digests of the whole proteome with Trypsin, Chymotrypsin, Trypsin+LysC, LysN, ArgC proteases suitable for different mass spec machines.| Try ESI |
 |
|---|
| ChTry ESI |
 |
|---|
| ArgC ESI |
 |
|---|
| LysN ESI |
 |
|---|
| TryLysC ESI |
 |
|---|
| Try MALDI |
 |
|---|
| ChTry MALDI |
 |
|---|
| ArgC MALDI |
 |
|---|
| LysN MALDI |
 |
|---|
| TryLysC MALDI |
 |
|---|
| Try LTQ |
 |
|---|
| ChTry LTQ |
 |
|---|
| ArgC LTQ |
 |
|---|
| LysN LTQ |
 |
|---|
| TryLysC LTQ |
 |
|---|
| Try MSlow |
 |
|---|
| ChTry MSlow |
 |
|---|
| ArgC MSlow |
 |
|---|
| LysN MSlow |
 |
|---|
| TryLysC MSlow |
 |
|---|
| Try MShigh |
 |
|---|
| ChTry MShigh |
 |
|---|
| ArgC MShigh |
 |
|---|
| LysN MShigh |
 |
|---|
| TryLysC MShigh |
 |
|---|
General Statistics
Number of major isoforms |
Number of additional isoforms |
Number of all proteins |
Number of amino acids |
Min. Seq. Length |
Max. Seq. Length |
Avg. Seq. Length |
Avg. Mol. Weight |
|---|---|---|---|---|---|---|---|
0 |
1832897 |
29 |
3754 |
315.5 |
35.61 |
Amino acid frequency
Ala |
Cys |
Asp |
Glu |
Phe |
Gly |
His |
Ile |
Lys |
Leu |
|---|---|---|---|---|---|---|---|---|---|
5.827 ± 0.038 | 1.205 ± 0.013 |
5.606 ± 0.024 | 7.39 ± 0.042 |
4.397 ± 0.023 | 6.363 ± 0.038 |
1.362 ± 0.013 | 9.762 ± 0.043 |
8.844 ± 0.032 | 8.848 ± 0.03 |
Met |
Asn |
Gln |
Pro |
Arg |
Ser |
Thr |
Val |
Trp |
Tyr |
|---|---|---|---|---|---|---|---|---|---|
2.578 ± 0.014 | 6.647 ± 0.031 |
2.742 ± 0.018 | 2.491 ± 0.019 |
3.098 ± 0.019 | 6.416 ± 0.029 |
5.091 ± 0.038 | 6.226 ± 0.026 |
0.821 ± 0.01 | 4.284 ± 0.028 |
Most of the basic statistics you can see at this page can be downloaded from this CSV file
Proteome-pI is available under Creative Commons Attribution-NoDerivs license, for more details see here
| Reference: Kozlowski LP. Proteome-pI 2.0: Proteome Isoelectric Point Database Update. Nucleic Acids Res. 2021, doi: 10.1093/nar/gkab944 | Contact: Lukasz P. Kozlowski |
