Nitrosomonas mobilis
Taxonomy: cellular organisms; Bacteria; Proteobacteria; Betaproteobacteria; Nitrosomonadales; Nitrosomonadaceae; Nitrosomonas
Average proteome isoelectric point is 6.73
Get precalculated fractions of proteins

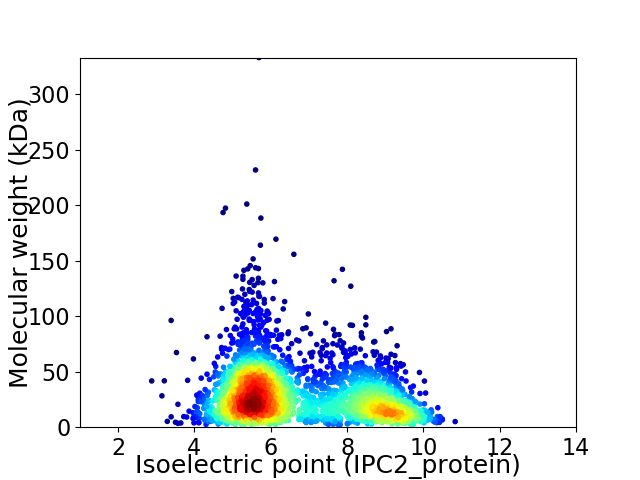
Virtual 2D-PAGE plot for 3034 proteins (isoelectric point calculated using IPC2_protein)
Get csv file with sequences according to given criteria:
* You can choose from 21 different methods for calculating isoelectric point
Summary statistics related to proteome-wise predictions


Protein with the lowest isoelectric point:
>tr|A0A1G5SAJ0|A0A1G5SAJ0_9PROT Putative DNA transport competence protein ComEA OS=Nitrosomonas mobilis OX=51642 GN=NSMM_110015 PE=4 SV=1
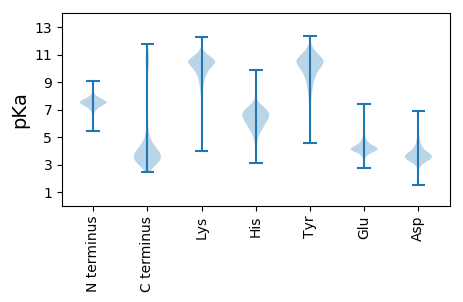
MM1 pKa = 6.66TQTYY5 pKa = 10.54QDD7 pKa = 3.88FLNALGFRR15 pKa = 11.84EE16 pKa = 4.39SSSIPDD22 pKa = 3.47GAQNYY27 pKa = 9.53DD28 pKa = 3.33VEE30 pKa = 4.43NSFGFIGKK38 pKa = 8.38YY39 pKa = 7.97QFGEE43 pKa = 3.81AALYY47 pKa = 10.66DD48 pKa = 4.02LGYY51 pKa = 10.96YY52 pKa = 10.13GADD55 pKa = 3.28NSDD58 pKa = 3.53SNLFKK63 pKa = 10.98NDD65 pKa = 3.59WIGNWSGKK73 pKa = 9.86NGIYY77 pKa = 10.37SKK79 pKa = 10.88QDD81 pKa = 3.21YY82 pKa = 9.96LDD84 pKa = 3.62NGFVQEE90 pKa = 4.16IIIRR94 pKa = 11.84EE95 pKa = 4.17WQGVLWNRR103 pKa = 11.84IEE105 pKa = 4.67FLALDD110 pKa = 3.83KK111 pKa = 11.92YY112 pKa = 10.62EE113 pKa = 4.21GQVLNGQSITLSGMLATAHH132 pKa = 6.98LIGAGSRR139 pKa = 11.84SSDD142 pKa = 3.12TAGLKK147 pKa = 10.56GYY149 pKa = 9.47LLSGATFSPSDD160 pKa = 3.82GNGTSANDD168 pKa = 3.24YY169 pKa = 7.84MALFEE174 pKa = 4.89GFQTPFSVDD183 pKa = 3.03HH184 pKa = 6.92SIDD187 pKa = 3.72EE188 pKa = 4.74IIAGGTGNDD197 pKa = 3.04ILQGFGGNDD206 pKa = 3.26TLIGNEE212 pKa = 4.4AIDD215 pKa = 3.59VAIYY219 pKa = 8.6TGPSTNYY226 pKa = 8.44TVQRR230 pKa = 11.84QSDD233 pKa = 4.1NLWTVHH239 pKa = 5.56ARR241 pKa = 11.84NGFPDD246 pKa = 3.83GTDD249 pKa = 2.97TLIDD253 pKa = 3.25IEE255 pKa = 4.77RR256 pKa = 11.84IRR258 pKa = 11.84FSDD261 pKa = 3.49TLLALDD267 pKa = 4.64LDD269 pKa = 4.59GNAGITAKK277 pKa = 10.49IIGAVFGADD286 pKa = 3.16SVADD290 pKa = 3.84TQLAGIGLNLLDD302 pKa = 5.88DD303 pKa = 4.28GTDD306 pKa = 3.41YY307 pKa = 8.74EE308 pKa = 4.82TLMQLAIHH316 pKa = 6.71AALGDD321 pKa = 3.85EE322 pKa = 4.69AASHH326 pKa = 5.64ATVVDD331 pKa = 4.14LLYY334 pKa = 10.97EE335 pKa = 4.13NVAGFSPPAADD346 pKa = 3.41EE347 pKa = 4.42ACFVDD352 pKa = 5.22LLDD355 pKa = 4.63SGAHH359 pKa = 5.08SVASIGIFAAEE370 pKa = 3.71TAINLEE376 pKa = 4.41NINFAGLSQFGLEE389 pKa = 3.95FGLWSVV395 pKa = 3.68
MM1 pKa = 6.66TQTYY5 pKa = 10.54QDD7 pKa = 3.88FLNALGFRR15 pKa = 11.84EE16 pKa = 4.39SSSIPDD22 pKa = 3.47GAQNYY27 pKa = 9.53DD28 pKa = 3.33VEE30 pKa = 4.43NSFGFIGKK38 pKa = 8.38YY39 pKa = 7.97QFGEE43 pKa = 3.81AALYY47 pKa = 10.66DD48 pKa = 4.02LGYY51 pKa = 10.96YY52 pKa = 10.13GADD55 pKa = 3.28NSDD58 pKa = 3.53SNLFKK63 pKa = 10.98NDD65 pKa = 3.59WIGNWSGKK73 pKa = 9.86NGIYY77 pKa = 10.37SKK79 pKa = 10.88QDD81 pKa = 3.21YY82 pKa = 9.96LDD84 pKa = 3.62NGFVQEE90 pKa = 4.16IIIRR94 pKa = 11.84EE95 pKa = 4.17WQGVLWNRR103 pKa = 11.84IEE105 pKa = 4.67FLALDD110 pKa = 3.83KK111 pKa = 11.92YY112 pKa = 10.62EE113 pKa = 4.21GQVLNGQSITLSGMLATAHH132 pKa = 6.98LIGAGSRR139 pKa = 11.84SSDD142 pKa = 3.12TAGLKK147 pKa = 10.56GYY149 pKa = 9.47LLSGATFSPSDD160 pKa = 3.82GNGTSANDD168 pKa = 3.24YY169 pKa = 7.84MALFEE174 pKa = 4.89GFQTPFSVDD183 pKa = 3.03HH184 pKa = 6.92SIDD187 pKa = 3.72EE188 pKa = 4.74IIAGGTGNDD197 pKa = 3.04ILQGFGGNDD206 pKa = 3.26TLIGNEE212 pKa = 4.4AIDD215 pKa = 3.59VAIYY219 pKa = 8.6TGPSTNYY226 pKa = 8.44TVQRR230 pKa = 11.84QSDD233 pKa = 4.1NLWTVHH239 pKa = 5.56ARR241 pKa = 11.84NGFPDD246 pKa = 3.83GTDD249 pKa = 2.97TLIDD253 pKa = 3.25IEE255 pKa = 4.77RR256 pKa = 11.84IRR258 pKa = 11.84FSDD261 pKa = 3.49TLLALDD267 pKa = 4.64LDD269 pKa = 4.59GNAGITAKK277 pKa = 10.49IIGAVFGADD286 pKa = 3.16SVADD290 pKa = 3.84TQLAGIGLNLLDD302 pKa = 5.88DD303 pKa = 4.28GTDD306 pKa = 3.41YY307 pKa = 8.74EE308 pKa = 4.82TLMQLAIHH316 pKa = 6.71AALGDD321 pKa = 3.85EE322 pKa = 4.69AASHH326 pKa = 5.64ATVVDD331 pKa = 4.14LLYY334 pKa = 10.97EE335 pKa = 4.13NVAGFSPPAADD346 pKa = 3.41EE347 pKa = 4.42ACFVDD352 pKa = 5.22LLDD355 pKa = 4.63SGAHH359 pKa = 5.08SVASIGIFAAEE370 pKa = 3.71TAINLEE376 pKa = 4.41NINFAGLSQFGLEE389 pKa = 3.95FGLWSVV395 pKa = 3.68
Molecular weight: 42.21 kDa
Isoelectric point according different methods:
Protein with the highest isoelectric point:
>tr|A0A1G5SDK7|A0A1G5SDK7_9PROT Transcription elongation factor GreA OS=Nitrosomonas mobilis OX=51642 GN=greA PE=3 SV=1
MM1 pKa = 7.42ATTSTAAIIVLAVITLTRR19 pKa = 11.84MPKK22 pKa = 9.98LRR24 pKa = 11.84PNHH27 pKa = 5.54SLNRR31 pKa = 11.84IRR33 pKa = 11.84NGALLRR39 pKa = 11.84SGPFTSTLL47 pKa = 3.4
MM1 pKa = 7.42ATTSTAAIIVLAVITLTRR19 pKa = 11.84MPKK22 pKa = 9.98LRR24 pKa = 11.84PNHH27 pKa = 5.54SLNRR31 pKa = 11.84IRR33 pKa = 11.84NGALLRR39 pKa = 11.84SGPFTSTLL47 pKa = 3.4
Molecular weight: 5.08 kDa
Isoelectric point according different methods:
Peptides (in silico digests for buttom-up proteomics)
Below you can find in silico digests of the whole proteome with Trypsin, Chymotrypsin, Trypsin+LysC, LysN, ArgC proteases suitable for different mass spec machines.| Try ESI |
 |
|---|
| ChTry ESI |
 |
|---|
| ArgC ESI |
 |
|---|
| LysN ESI |
 |
|---|
| TryLysC ESI |
 |
|---|
| Try MALDI |
 |
|---|
| ChTry MALDI |
 |
|---|
| ArgC MALDI |
 |
|---|
| LysN MALDI |
 |
|---|
| TryLysC MALDI |
 |
|---|
| Try LTQ |
 |
|---|
| ChTry LTQ |
 |
|---|
| ArgC LTQ |
 |
|---|
| LysN LTQ |
 |
|---|
| TryLysC LTQ |
 |
|---|
| Try MSlow |
 |
|---|
| ChTry MSlow |
 |
|---|
| ArgC MSlow |
 |
|---|
| LysN MSlow |
 |
|---|
| TryLysC MSlow |
 |
|---|
| Try MShigh |
 |
|---|
| ChTry MShigh |
 |
|---|
| ArgC MShigh |
 |
|---|
| LysN MShigh |
 |
|---|
| TryLysC MShigh |
 |
|---|
General Statistics
Number of major isoforms |
Number of additional isoforms |
Number of all proteins |
Number of amino acids |
Min. Seq. Length |
Max. Seq. Length |
Avg. Seq. Length |
Avg. Mol. Weight |
|---|---|---|---|---|---|---|---|
0 |
867340 |
20 |
2969 |
285.9 |
31.78 |
Amino acid frequency
Ala |
Cys |
Asp |
Glu |
Phe |
Gly |
His |
Ile |
Lys |
Leu |
|---|---|---|---|---|---|---|---|---|---|
9.311 ± 0.054 | 1.066 ± 0.017 |
5.208 ± 0.034 | 5.772 ± 0.042 |
4.068 ± 0.032 | 6.939 ± 0.048 |
2.512 ± 0.026 | 6.551 ± 0.038 |
4.494 ± 0.043 | 10.842 ± 0.067 |
Met |
Asn |
Gln |
Pro |
Arg |
Ser |
Thr |
Val |
Trp |
Tyr |
|---|---|---|---|---|---|---|---|---|---|
2.525 ± 0.023 | 3.864 ± 0.036 |
4.379 ± 0.028 | 4.467 ± 0.034 |
5.866 ± 0.035 | 6.064 ± 0.036 |
5.419 ± 0.035 | 6.558 ± 0.043 |
1.304 ± 0.021 | 2.79 ± 0.027 |
Most of the basic statistics you can see at this page can be downloaded from this CSV file
Proteome-pI is available under Creative Commons Attribution-NoDerivs license, for more details see here
| Reference: Kozlowski LP. Proteome-pI 2.0: Proteome Isoelectric Point Database Update. Nucleic Acids Res. 2021, doi: 10.1093/nar/gkab944 | Contact: Lukasz P. Kozlowski |
