Aspergillus welwitschiae
Taxonomy: cellular organisms; Eukaryota; Opisthokonta; Fungi; Dikarya; Ascomycota; saccharomyceta; Pezizomycotina; leotiomyceta; Eurotiomycetes; Eurotiomycetidae; Eurotiales; Aspergillaceae; Aspergillus
Average proteome isoelectric point is 6.56
Get precalculated fractions of proteins

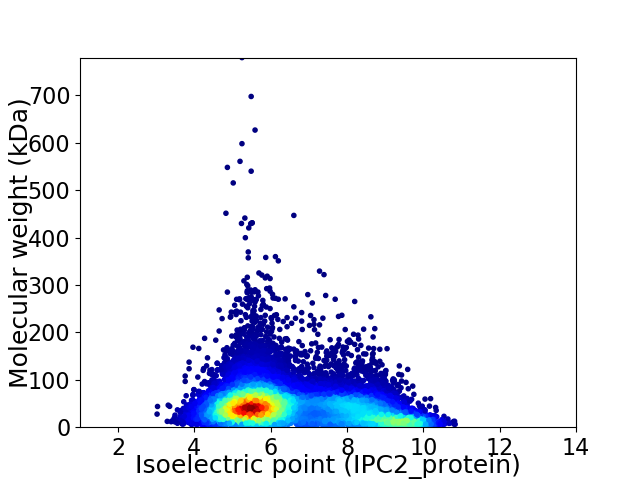
Virtual 2D-PAGE plot for 13680 proteins (isoelectric point calculated using IPC2_protein)
Get csv file with sequences according to given criteria:
* You can choose from 21 different methods for calculating isoelectric point
Summary statistics related to proteome-wise predictions


Protein with the lowest isoelectric point:
>tr|A0A3F3PWB2|A0A3F3PWB2_9EURO FAD binding domain-domain-containing protein OS=Aspergillus welwitschiae OX=1341132 GN=BDQ94DRAFT_160760 PE=3 SV=1
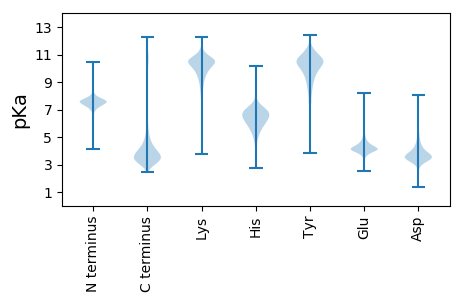
MM1 pKa = 7.07KK2 pKa = 9.9TYY4 pKa = 10.84GLWSTLAALGSFTLSSAKK22 pKa = 9.68TINFVAHH29 pKa = 7.08EE30 pKa = 4.68DD31 pKa = 3.7DD32 pKa = 5.65DD33 pKa = 5.68LLFLSPDD40 pKa = 4.47LIRR43 pKa = 11.84DD44 pKa = 3.6ILSGEE49 pKa = 4.39PIRR52 pKa = 11.84TVFLTAGDD60 pKa = 4.0AGLGSDD66 pKa = 3.5YY67 pKa = 11.0WNARR71 pKa = 11.84EE72 pKa = 4.0EE73 pKa = 4.44GSRR76 pKa = 11.84AAYY79 pKa = 10.58ARR81 pKa = 11.84MAVASNNWDD90 pKa = 3.2EE91 pKa = 5.09DD92 pKa = 4.52VIFVGDD98 pKa = 4.0KK99 pKa = 10.94SITLYY104 pKa = 10.31TLQDD108 pKa = 4.01DD109 pKa = 4.91DD110 pKa = 5.76DD111 pKa = 5.1ISLAFMHH118 pKa = 6.84LPDD121 pKa = 4.93GNMDD125 pKa = 3.49GTGFGPDD132 pKa = 3.85QNDD135 pKa = 3.5SLQKK139 pKa = 10.46LWNGDD144 pKa = 2.49IDD146 pKa = 4.34VIRR149 pKa = 11.84TIDD152 pKa = 3.45GSGIEE157 pKa = 4.11YY158 pKa = 9.48TRR160 pKa = 11.84DD161 pKa = 3.19EE162 pKa = 4.5LLEE165 pKa = 4.35TIAALIDD172 pKa = 4.57DD173 pKa = 5.25FDD175 pKa = 5.85PDD177 pKa = 3.61EE178 pKa = 4.89VKK180 pKa = 10.28TGDD183 pKa = 3.6YY184 pKa = 11.43VNDD187 pKa = 4.35FGDD190 pKa = 4.38GDD192 pKa = 3.99HH193 pKa = 7.18SDD195 pKa = 4.75HH196 pKa = 6.31YY197 pKa = 10.96ACGYY201 pKa = 10.12FVDD204 pKa = 4.93NALQQADD211 pKa = 3.89SDD213 pKa = 4.19AGLTGYY219 pKa = 10.12YY220 pKa = 9.95GYY222 pKa = 9.31PIQYY226 pKa = 9.27MDD228 pKa = 4.34VNLDD232 pKa = 3.65DD233 pKa = 6.06SDD235 pKa = 5.69IEE237 pKa = 4.29DD238 pKa = 3.65KK239 pKa = 11.42TNIFYY244 pKa = 10.62EE245 pKa = 4.21YY246 pKa = 10.82ADD248 pKa = 4.29YY249 pKa = 8.64DD250 pKa = 4.13TATCASDD257 pKa = 4.01DD258 pKa = 3.99ACSSRR263 pKa = 11.84PEE265 pKa = 4.3SAWLLRR271 pKa = 11.84EE272 pKa = 4.08YY273 pKa = 10.62EE274 pKa = 4.27VV275 pKa = 3.97
MM1 pKa = 7.07KK2 pKa = 9.9TYY4 pKa = 10.84GLWSTLAALGSFTLSSAKK22 pKa = 9.68TINFVAHH29 pKa = 7.08EE30 pKa = 4.68DD31 pKa = 3.7DD32 pKa = 5.65DD33 pKa = 5.68LLFLSPDD40 pKa = 4.47LIRR43 pKa = 11.84DD44 pKa = 3.6ILSGEE49 pKa = 4.39PIRR52 pKa = 11.84TVFLTAGDD60 pKa = 4.0AGLGSDD66 pKa = 3.5YY67 pKa = 11.0WNARR71 pKa = 11.84EE72 pKa = 4.0EE73 pKa = 4.44GSRR76 pKa = 11.84AAYY79 pKa = 10.58ARR81 pKa = 11.84MAVASNNWDD90 pKa = 3.2EE91 pKa = 5.09DD92 pKa = 4.52VIFVGDD98 pKa = 4.0KK99 pKa = 10.94SITLYY104 pKa = 10.31TLQDD108 pKa = 4.01DD109 pKa = 4.91DD110 pKa = 5.76DD111 pKa = 5.1ISLAFMHH118 pKa = 6.84LPDD121 pKa = 4.93GNMDD125 pKa = 3.49GTGFGPDD132 pKa = 3.85QNDD135 pKa = 3.5SLQKK139 pKa = 10.46LWNGDD144 pKa = 2.49IDD146 pKa = 4.34VIRR149 pKa = 11.84TIDD152 pKa = 3.45GSGIEE157 pKa = 4.11YY158 pKa = 9.48TRR160 pKa = 11.84DD161 pKa = 3.19EE162 pKa = 4.5LLEE165 pKa = 4.35TIAALIDD172 pKa = 4.57DD173 pKa = 5.25FDD175 pKa = 5.85PDD177 pKa = 3.61EE178 pKa = 4.89VKK180 pKa = 10.28TGDD183 pKa = 3.6YY184 pKa = 11.43VNDD187 pKa = 4.35FGDD190 pKa = 4.38GDD192 pKa = 3.99HH193 pKa = 7.18SDD195 pKa = 4.75HH196 pKa = 6.31YY197 pKa = 10.96ACGYY201 pKa = 10.12FVDD204 pKa = 4.93NALQQADD211 pKa = 3.89SDD213 pKa = 4.19AGLTGYY219 pKa = 10.12YY220 pKa = 9.95GYY222 pKa = 9.31PIQYY226 pKa = 9.27MDD228 pKa = 4.34VNLDD232 pKa = 3.65DD233 pKa = 6.06SDD235 pKa = 5.69IEE237 pKa = 4.29DD238 pKa = 3.65KK239 pKa = 11.42TNIFYY244 pKa = 10.62EE245 pKa = 4.21YY246 pKa = 10.82ADD248 pKa = 4.29YY249 pKa = 8.64DD250 pKa = 4.13TATCASDD257 pKa = 4.01DD258 pKa = 3.99ACSSRR263 pKa = 11.84PEE265 pKa = 4.3SAWLLRR271 pKa = 11.84EE272 pKa = 4.08YY273 pKa = 10.62EE274 pKa = 4.27VV275 pKa = 3.97
Molecular weight: 30.48 kDa
Isoelectric point according different methods:
Protein with the highest isoelectric point:
>tr|A0A3F3QET8|A0A3F3QET8_9EURO MFS general substrate transporter OS=Aspergillus welwitschiae OX=1341132 GN=BDQ94DRAFT_136924 PE=3 SV=1
MM1 pKa = 7.64RR2 pKa = 11.84HH3 pKa = 5.24NPQRR7 pKa = 11.84GEE9 pKa = 3.95TRR11 pKa = 11.84RR12 pKa = 11.84LRR14 pKa = 11.84AQGWRR19 pKa = 11.84QGIASGGSVIGAWRR33 pKa = 11.84AGQSARR39 pKa = 11.84PWVSIFHH46 pKa = 7.11AKK48 pKa = 8.52TASQVRR54 pKa = 11.84RR55 pKa = 3.61
MM1 pKa = 7.64RR2 pKa = 11.84HH3 pKa = 5.24NPQRR7 pKa = 11.84GEE9 pKa = 3.95TRR11 pKa = 11.84RR12 pKa = 11.84LRR14 pKa = 11.84AQGWRR19 pKa = 11.84QGIASGGSVIGAWRR33 pKa = 11.84AGQSARR39 pKa = 11.84PWVSIFHH46 pKa = 7.11AKK48 pKa = 8.52TASQVRR54 pKa = 11.84RR55 pKa = 3.61
Molecular weight: 6.18 kDa
Isoelectric point according different methods:
Peptides (in silico digests for buttom-up proteomics)
Below you can find in silico digests of the whole proteome with Trypsin, Chymotrypsin, Trypsin+LysC, LysN, ArgC proteases suitable for different mass spec machines.| Try ESI |
 |
|---|
| ChTry ESI |
 |
|---|
| ArgC ESI |
 |
|---|
| LysN ESI |
 |
|---|
| TryLysC ESI |
 |
|---|
| Try MALDI |
 |
|---|
| ChTry MALDI |
 |
|---|
| ArgC MALDI |
 |
|---|
| LysN MALDI |
 |
|---|
| TryLysC MALDI |
 |
|---|
| Try LTQ |
 |
|---|
| ChTry LTQ |
 |
|---|
| ArgC LTQ |
 |
|---|
| LysN LTQ |
 |
|---|
| TryLysC LTQ |
 |
|---|
| Try MSlow |
 |
|---|
| ChTry MSlow |
 |
|---|
| ArgC MSlow |
 |
|---|
| LysN MSlow |
 |
|---|
| TryLysC MSlow |
 |
|---|
| Try MShigh |
 |
|---|
| ChTry MShigh |
 |
|---|
| ArgC MShigh |
 |
|---|
| LysN MShigh |
 |
|---|
| TryLysC MShigh |
 |
|---|
General Statistics
Number of major isoforms |
Number of additional isoforms |
Number of all proteins |
Number of amino acids |
Min. Seq. Length |
Max. Seq. Length |
Avg. Seq. Length |
Avg. Mol. Weight |
|---|---|---|---|---|---|---|---|
0 |
6103230 |
49 |
7054 |
446.1 |
49.47 |
Amino acid frequency
Ala |
Cys |
Asp |
Glu |
Phe |
Gly |
His |
Ile |
Lys |
Leu |
|---|---|---|---|---|---|---|---|---|---|
8.374 ± 0.022 | 1.383 ± 0.009 |
5.534 ± 0.014 | 6.007 ± 0.017 |
3.763 ± 0.011 | 6.757 ± 0.017 |
2.504 ± 0.01 | 5.013 ± 0.014 |
4.358 ± 0.016 | 9.238 ± 0.022 |
Met |
Asn |
Gln |
Pro |
Arg |
Ser |
Thr |
Val |
Trp |
Tyr |
|---|---|---|---|---|---|---|---|---|---|
2.212 ± 0.008 | 3.578 ± 0.012 |
6.015 ± 0.021 | 4.009 ± 0.013 |
6.164 ± 0.019 | 8.346 ± 0.026 |
6.02 ± 0.015 | 6.253 ± 0.015 |
1.526 ± 0.007 | 2.945 ± 0.011 |
Most of the basic statistics you can see at this page can be downloaded from this CSV file
Proteome-pI is available under Creative Commons Attribution-NoDerivs license, for more details see here
| Reference: Kozlowski LP. Proteome-pI 2.0: Proteome Isoelectric Point Database Update. Nucleic Acids Res. 2021, doi: 10.1093/nar/gkab944 | Contact: Lukasz P. Kozlowski |
