Bovine herpesvirus 4 (BoHV-4) (Movar virus)
Taxonomy: Viruses; Duplodnaviria; Heunggongvirae; Peploviricota; Herviviricetes; Herpesvirales; Herpesviridae; Gammaherpesvirinae; Rhadinovirus
Average proteome isoelectric point is 6.83
Get precalculated fractions of proteins

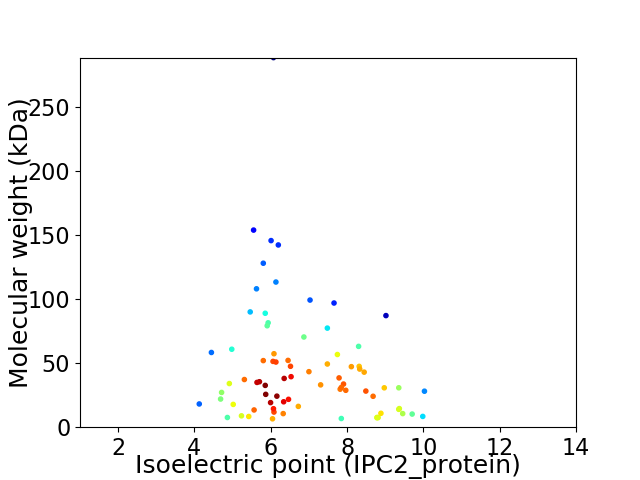
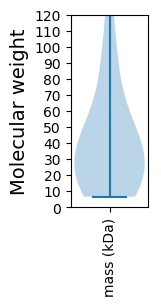
Virtual 2D-PAGE plot for 78 proteins (isoelectric point calculated using IPC2_protein)
Get csv file with sequences according to given criteria:
* You can choose from 21 different methods for calculating isoelectric point
Summary statistics related to proteome-wise predictions


Protein with the lowest isoelectric point:
>tr|Q99CW7|Q99CW7_BHV4 Tegument protein/v-FGAM-synthetase OS=Bovine herpesvirus 4 OX=10385 PE=4 SV=1
MM1 pKa = 6.94KK2 pKa = 10.01TKK4 pKa = 10.7ASDD7 pKa = 3.38QLQDD11 pKa = 3.95DD12 pKa = 4.29VEE14 pKa = 4.53KK15 pKa = 10.93QSSHH19 pKa = 6.53PVLHH23 pKa = 6.5LQDD26 pKa = 5.25DD27 pKa = 4.54EE28 pKa = 5.59NDD30 pKa = 3.92APPPGPPPNPPVEE43 pKa = 4.45RR44 pKa = 11.84PNGTHH49 pKa = 7.19GPPQLMEE56 pKa = 4.05YY57 pKa = 9.9EE58 pKa = 4.5EE59 pKa = 5.38PGDD62 pKa = 4.6DD63 pKa = 4.56PPPGPPPSLPPVEE76 pKa = 4.75RR77 pKa = 11.84PNGTRR82 pKa = 11.84GSNRR86 pKa = 11.84PGDD89 pKa = 3.83NDD91 pKa = 4.78DD92 pKa = 5.31PEE94 pKa = 6.89DD95 pKa = 4.62DD96 pKa = 4.57PPPRR100 pKa = 11.84PPPSPPPVNSQNSNGRR116 pKa = 11.84PPSPHH121 pKa = 7.06EE122 pKa = 4.01YY123 pKa = 10.45DD124 pKa = 4.13EE125 pKa = 5.24PPDD128 pKa = 4.37DD129 pKa = 5.36GGNHH133 pKa = 6.93DD134 pKa = 5.4PPPGPYY140 pKa = 9.81DD141 pKa = 3.75DD142 pKa = 5.84AGLSSTPGNYY152 pKa = 9.07EE153 pKa = 3.77GPIEE157 pKa = 4.43GAPEE161 pKa = 4.97DD162 pKa = 4.14YY163 pKa = 10.95LKK165 pKa = 11.22LHH167 pKa = 6.03TRR169 pKa = 11.84VV170 pKa = 3.18
MM1 pKa = 6.94KK2 pKa = 10.01TKK4 pKa = 10.7ASDD7 pKa = 3.38QLQDD11 pKa = 3.95DD12 pKa = 4.29VEE14 pKa = 4.53KK15 pKa = 10.93QSSHH19 pKa = 6.53PVLHH23 pKa = 6.5LQDD26 pKa = 5.25DD27 pKa = 4.54EE28 pKa = 5.59NDD30 pKa = 3.92APPPGPPPNPPVEE43 pKa = 4.45RR44 pKa = 11.84PNGTHH49 pKa = 7.19GPPQLMEE56 pKa = 4.05YY57 pKa = 9.9EE58 pKa = 4.5EE59 pKa = 5.38PGDD62 pKa = 4.6DD63 pKa = 4.56PPPGPPPSLPPVEE76 pKa = 4.75RR77 pKa = 11.84PNGTRR82 pKa = 11.84GSNRR86 pKa = 11.84PGDD89 pKa = 3.83NDD91 pKa = 4.78DD92 pKa = 5.31PEE94 pKa = 6.89DD95 pKa = 4.62DD96 pKa = 4.57PPPRR100 pKa = 11.84PPPSPPPVNSQNSNGRR116 pKa = 11.84PPSPHH121 pKa = 7.06EE122 pKa = 4.01YY123 pKa = 10.45DD124 pKa = 4.13EE125 pKa = 5.24PPDD128 pKa = 4.37DD129 pKa = 5.36GGNHH133 pKa = 6.93DD134 pKa = 5.4PPPGPYY140 pKa = 9.81DD141 pKa = 3.75DD142 pKa = 5.84AGLSSTPGNYY152 pKa = 9.07EE153 pKa = 3.77GPIEE157 pKa = 4.43GAPEE161 pKa = 4.97DD162 pKa = 4.14YY163 pKa = 10.95LKK165 pKa = 11.22LHH167 pKa = 6.03TRR169 pKa = 11.84VV170 pKa = 3.18
Molecular weight: 18.17 kDa
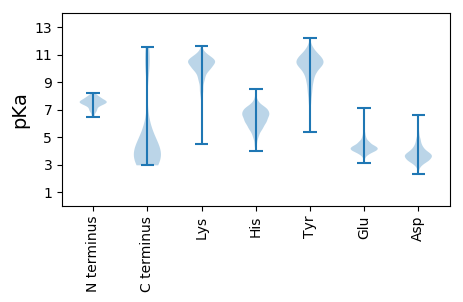
Isoelectric point according different methods:
Protein with the highest isoelectric point:
>tr|Q99CW5|Q99CW5_BHV4 Uncharacterized protein OS=Bovine herpesvirus 4 OX=10385 PE=4 SV=1
MM1 pKa = 6.53NTRR4 pKa = 11.84RR5 pKa = 11.84ANKK8 pKa = 9.68YY9 pKa = 8.56FFRR12 pKa = 11.84CLCGDD17 pKa = 4.01ILRR20 pKa = 11.84LTKK23 pKa = 10.7NRR25 pKa = 11.84VHH27 pKa = 6.5NSKK30 pKa = 10.35SACTNAVTSNNSCFTPFSAQAPAMAHH56 pKa = 6.48AARR59 pKa = 11.84HH60 pKa = 4.99AEE62 pKa = 3.97MYY64 pKa = 10.29NIHH67 pKa = 7.19RR68 pKa = 11.84NTLVKK73 pKa = 10.35DD74 pKa = 3.31KK75 pKa = 10.85RR76 pKa = 11.84LQNKK80 pKa = 8.97KK81 pKa = 10.16RR82 pKa = 11.84EE83 pKa = 4.22QTVKK87 pKa = 10.59SYY89 pKa = 11.51
MM1 pKa = 6.53NTRR4 pKa = 11.84RR5 pKa = 11.84ANKK8 pKa = 9.68YY9 pKa = 8.56FFRR12 pKa = 11.84CLCGDD17 pKa = 4.01ILRR20 pKa = 11.84LTKK23 pKa = 10.7NRR25 pKa = 11.84VHH27 pKa = 6.5NSKK30 pKa = 10.35SACTNAVTSNNSCFTPFSAQAPAMAHH56 pKa = 6.48AARR59 pKa = 11.84HH60 pKa = 4.99AEE62 pKa = 3.97MYY64 pKa = 10.29NIHH67 pKa = 7.19RR68 pKa = 11.84NTLVKK73 pKa = 10.35DD74 pKa = 3.31KK75 pKa = 10.85RR76 pKa = 11.84LQNKK80 pKa = 8.97KK81 pKa = 10.16RR82 pKa = 11.84EE83 pKa = 4.22QTVKK87 pKa = 10.59SYY89 pKa = 11.51
Molecular weight: 10.28 kDa
Isoelectric point according different methods:
Peptides (in silico digests for buttom-up proteomics)
Below you can find in silico digests of the whole proteome with Trypsin, Chymotrypsin, Trypsin+LysC, LysN, ArgC proteases suitable for different mass spec machines.| Try ESI |
 |
|---|
| ChTry ESI |
 |
|---|
| ArgC ESI |
 |
|---|
| LysN ESI |
 |
|---|
| TryLysC ESI |
 |
|---|
| Try MALDI |
 |
|---|
| ChTry MALDI |
 |
|---|
| ArgC MALDI |
 |
|---|
| LysN MALDI |
 |
|---|
| TryLysC MALDI |
 |
|---|
| Try LTQ |
 |
|---|
| ChTry LTQ |
 |
|---|
| ArgC LTQ |
 |
|---|
| LysN LTQ |
 |
|---|
| TryLysC LTQ |
 |
|---|
| Try MSlow |
 |
|---|
| ChTry MSlow |
 |
|---|
| ArgC MSlow |
 |
|---|
| LysN MSlow |
 |
|---|
| TryLysC MSlow |
 |
|---|
| Try MShigh |
 |
|---|
| ChTry MShigh |
 |
|---|
| ArgC MShigh |
 |
|---|
| LysN MShigh |
 |
|---|
| TryLysC MShigh |
 |
|---|
General Statistics
Number of major isoforms |
Number of additional isoforms |
Number of all proteins |
Number of amino acids |
Min. Seq. Length |
Max. Seq. Length |
Avg. Seq. Length |
Avg. Mol. Weight |
|---|---|---|---|---|---|---|---|
0 |
32335 |
57 |
2569 |
414.6 |
46.96 |
Amino acid frequency
Ala |
Cys |
Asp |
Glu |
Phe |
Gly |
His |
Ile |
Lys |
Leu |
|---|---|---|---|---|---|---|---|---|---|
4.543 ± 0.176 | 2.598 ± 0.195 |
4.868 ± 0.136 | 4.865 ± 0.187 |
4.859 ± 0.186 | 4.676 ± 0.215 |
2.824 ± 0.082 | 7.249 ± 0.218 |
5.944 ± 0.195 | 9.964 ± 0.201 |
Met |
Asn |
Gln |
Pro |
Arg |
Ser |
Thr |
Val |
Trp |
Tyr |
|---|---|---|---|---|---|---|---|---|---|
2.629 ± 0.139 | 5.356 ± 0.158 |
5.749 ± 0.355 | 4.135 ± 0.164 |
3.776 ± 0.16 | 8.059 ± 0.237 |
7.128 ± 0.256 | 5.833 ± 0.247 |
1.03 ± 0.072 | 3.915 ± 0.146 |
Most of the basic statistics you can see at this page can be downloaded from this CSV file
Proteome-pI is available under Creative Commons Attribution-NoDerivs license, for more details see here
| Reference: Kozlowski LP. Proteome-pI 2.0: Proteome Isoelectric Point Database Update. Nucleic Acids Res. 2021, doi: 10.1093/nar/gkab944 | Contact: Lukasz P. Kozlowski |
