Stenotrophomonas phage SMA9
Taxonomy: Viruses; Monodnaviria; Loebvirae; Hofneiviricota; Faserviricetes; Tubulavirales; Inoviridae; Staminivirus; Stenotrophomonas virus SMA9
Average proteome isoelectric point is 7.25
Get precalculated fractions of proteins

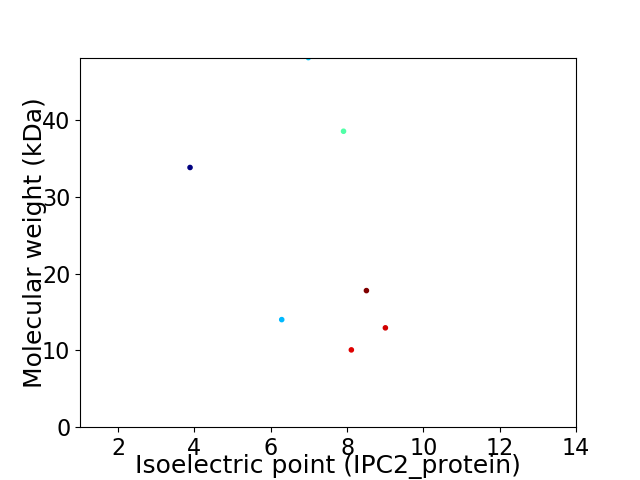
Virtual 2D-PAGE plot for 7 proteins (isoelectric point calculated using IPC2_protein)
Get csv file with sequences according to given criteria:
* You can choose from 21 different methods for calculating isoelectric point
Summary statistics related to proteome-wise predictions


Protein with the lowest isoelectric point:
>tr|Q4LAU3|Q4LAU3_9VIRU Uncharacterized protein OS=Stenotrophomonas phage SMA9 OX=334856 PE=4 SV=1
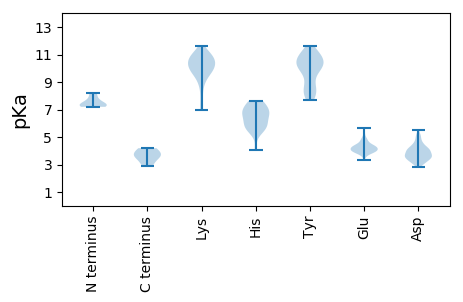
MM1 pKa = 7.41SRR3 pKa = 11.84LALLMLATAALMLSPRR19 pKa = 11.84VLAADD24 pKa = 4.81ASCSTSPSVLEE35 pKa = 4.34SSCPDD40 pKa = 2.97EE41 pKa = 4.58GLAYY45 pKa = 10.04AAAWATANAQAAKK58 pKa = 10.46SNTGSSGWCAGVKK71 pKa = 9.73KK72 pKa = 10.53QGVGSFLAYY81 pKa = 7.82VTPCSSPGPAYY92 pKa = 7.67EE93 pKa = 3.79TRR95 pKa = 11.84TRR97 pKa = 11.84SFSALCSARR106 pKa = 11.84AEE108 pKa = 4.13EE109 pKa = 4.87FGWQGGEE116 pKa = 3.77TAASVNACHH125 pKa = 6.51NGCMYY130 pKa = 10.45TSSLDD135 pKa = 3.65PKK137 pKa = 9.04GTAGVSFTPTGGTCTEE153 pKa = 4.42ADD155 pKa = 3.64APAPTPAGDD164 pKa = 3.92GGDD167 pKa = 3.66PGEE170 pKa = 4.8GGGGDD175 pKa = 3.88GGGNDD180 pKa = 4.15PGGGDD185 pKa = 3.31GGGDD189 pKa = 3.22NGGGDD194 pKa = 3.97GDD196 pKa = 4.19GGGNNPGGGDD206 pKa = 3.51GGSGGGDD213 pKa = 3.22GDD215 pKa = 4.49GDD217 pKa = 4.06GDD219 pKa = 4.55GDD221 pKa = 4.55GDD223 pKa = 4.12GDD225 pKa = 4.32GDD227 pKa = 4.15GGGPGPGPGPGEE239 pKa = 4.18GDD241 pKa = 3.01GDD243 pKa = 4.18GPGEE247 pKa = 4.22VGSDD251 pKa = 3.29GGPLYY256 pKa = 10.86EE257 pKa = 4.6RR258 pKa = 11.84DD259 pKa = 4.0KK260 pKa = 11.65NLTLDD265 pKa = 4.08KK266 pKa = 11.01VFNDD270 pKa = 4.57FKK272 pKa = 11.13QQAEE276 pKa = 4.41KK277 pKa = 11.05LPIIQATKK285 pKa = 10.46SFFTVSVGGSCPVFTLPASQYY306 pKa = 8.54WDD308 pKa = 2.86TMTFDD313 pKa = 3.4LHH315 pKa = 7.4CYY317 pKa = 8.76GVIYY321 pKa = 10.34EE322 pKa = 4.63SFLLMGWVLLAIAAFMAAKK341 pKa = 10.12IALTT345 pKa = 3.68
MM1 pKa = 7.41SRR3 pKa = 11.84LALLMLATAALMLSPRR19 pKa = 11.84VLAADD24 pKa = 4.81ASCSTSPSVLEE35 pKa = 4.34SSCPDD40 pKa = 2.97EE41 pKa = 4.58GLAYY45 pKa = 10.04AAAWATANAQAAKK58 pKa = 10.46SNTGSSGWCAGVKK71 pKa = 9.73KK72 pKa = 10.53QGVGSFLAYY81 pKa = 7.82VTPCSSPGPAYY92 pKa = 7.67EE93 pKa = 3.79TRR95 pKa = 11.84TRR97 pKa = 11.84SFSALCSARR106 pKa = 11.84AEE108 pKa = 4.13EE109 pKa = 4.87FGWQGGEE116 pKa = 3.77TAASVNACHH125 pKa = 6.51NGCMYY130 pKa = 10.45TSSLDD135 pKa = 3.65PKK137 pKa = 9.04GTAGVSFTPTGGTCTEE153 pKa = 4.42ADD155 pKa = 3.64APAPTPAGDD164 pKa = 3.92GGDD167 pKa = 3.66PGEE170 pKa = 4.8GGGGDD175 pKa = 3.88GGGNDD180 pKa = 4.15PGGGDD185 pKa = 3.31GGGDD189 pKa = 3.22NGGGDD194 pKa = 3.97GDD196 pKa = 4.19GGGNNPGGGDD206 pKa = 3.51GGSGGGDD213 pKa = 3.22GDD215 pKa = 4.49GDD217 pKa = 4.06GDD219 pKa = 4.55GDD221 pKa = 4.55GDD223 pKa = 4.12GDD225 pKa = 4.32GDD227 pKa = 4.15GGGPGPGPGPGEE239 pKa = 4.18GDD241 pKa = 3.01GDD243 pKa = 4.18GPGEE247 pKa = 4.22VGSDD251 pKa = 3.29GGPLYY256 pKa = 10.86EE257 pKa = 4.6RR258 pKa = 11.84DD259 pKa = 4.0KK260 pKa = 11.65NLTLDD265 pKa = 4.08KK266 pKa = 11.01VFNDD270 pKa = 4.57FKK272 pKa = 11.13QQAEE276 pKa = 4.41KK277 pKa = 11.05LPIIQATKK285 pKa = 10.46SFFTVSVGGSCPVFTLPASQYY306 pKa = 8.54WDD308 pKa = 2.86TMTFDD313 pKa = 3.4LHH315 pKa = 7.4CYY317 pKa = 8.76GVIYY321 pKa = 10.34EE322 pKa = 4.63SFLLMGWVLLAIAAFMAAKK341 pKa = 10.12IALTT345 pKa = 3.68
Molecular weight: 33.85 kDa
Isoelectric point according different methods:
Protein with the highest isoelectric point:
>tr|Q4LAU4|Q4LAU4_9VIRU Putative zonula occludens toxin OS=Stenotrophomonas phage SMA9 OX=334856 GN=zot PE=4 SV=1
MM1 pKa = 7.21MNFLAFLMPHH11 pKa = 6.79AGWLTDD17 pKa = 3.43LTQWLLRR24 pKa = 11.84QIQRR28 pKa = 11.84FWDD31 pKa = 3.45ALVAFFNDD39 pKa = 3.73LLILAIQTMLALMIKK54 pKa = 9.71MIGALPVPDD63 pKa = 3.53VLKK66 pKa = 10.6NYY68 pKa = 10.66SIGTLLGNAGSTVGWFVQTFKK89 pKa = 11.14LGEE92 pKa = 4.18CLALIGSAVAFRR104 pKa = 11.84ILRR107 pKa = 11.84KK108 pKa = 10.17VMTMGKK114 pKa = 7.64WW115 pKa = 2.89
MM1 pKa = 7.21MNFLAFLMPHH11 pKa = 6.79AGWLTDD17 pKa = 3.43LTQWLLRR24 pKa = 11.84QIQRR28 pKa = 11.84FWDD31 pKa = 3.45ALVAFFNDD39 pKa = 3.73LLILAIQTMLALMIKK54 pKa = 9.71MIGALPVPDD63 pKa = 3.53VLKK66 pKa = 10.6NYY68 pKa = 10.66SIGTLLGNAGSTVGWFVQTFKK89 pKa = 11.14LGEE92 pKa = 4.18CLALIGSAVAFRR104 pKa = 11.84ILRR107 pKa = 11.84KK108 pKa = 10.17VMTMGKK114 pKa = 7.64WW115 pKa = 2.89
Molecular weight: 12.95 kDa
Isoelectric point according different methods:
Peptides (in silico digests for buttom-up proteomics)
Below you can find in silico digests of the whole proteome with Trypsin, Chymotrypsin, Trypsin+LysC, LysN, ArgC proteases suitable for different mass spec machines.| Try ESI |
 |
|---|
| ChTry ESI |
 |
|---|
| ArgC ESI |
 |
|---|
| LysN ESI |
 |
|---|
| TryLysC ESI |
 |
|---|
| Try MALDI |
 |
|---|
| ChTry MALDI |
 |
|---|
| ArgC MALDI |
 |
|---|
| LysN MALDI |
 |
|---|
| TryLysC MALDI |
 |
|---|
| Try LTQ |
 |
|---|
| ChTry LTQ |
 |
|---|
| ArgC LTQ |
 |
|---|
| LysN LTQ |
 |
|---|
| TryLysC LTQ |
 |
|---|
| Try MSlow |
 |
|---|
| ChTry MSlow |
 |
|---|
| ArgC MSlow |
 |
|---|
| LysN MSlow |
 |
|---|
| TryLysC MSlow |
 |
|---|
| Try MShigh |
 |
|---|
| ChTry MShigh |
 |
|---|
| ArgC MShigh |
 |
|---|
| LysN MShigh |
 |
|---|
| TryLysC MShigh |
 |
|---|
General Statistics
Number of major isoforms |
Number of additional isoforms |
Number of all proteins |
Number of amino acids |
Min. Seq. Length |
Max. Seq. Length |
Avg. Seq. Length |
Avg. Mol. Weight |
|---|---|---|---|---|---|---|---|
0 |
1631 |
92 |
442 |
233.0 |
25.06 |
Amino acid frequency
Ala |
Cys |
Asp |
Glu |
Phe |
Gly |
His |
Ile |
Lys |
Leu |
|---|---|---|---|---|---|---|---|---|---|
10.668 ± 0.841 | 1.778 ± 0.397 |
5.886 ± 0.613 | 4.905 ± 0.762 |
3.74 ± 0.402 | 11.772 ± 2.047 |
1.717 ± 0.4 | 3.924 ± 0.6 |
4.414 ± 0.492 | 8.645 ± 1.001 |
Met |
Asn |
Gln |
Pro |
Arg |
Ser |
Thr |
Val |
Trp |
Tyr |
|---|---|---|---|---|---|---|---|---|---|
2.514 ± 0.529 | 3.004 ± 0.25 |
5.641 ± 0.805 | 3.311 ± 0.469 |
5.947 ± 1.276 | 5.518 ± 0.902 |
4.537 ± 0.768 | 7.48 ± 0.991 |
2.023 ± 0.481 | 2.575 ± 0.368 |
Most of the basic statistics you can see at this page can be downloaded from this CSV file
Proteome-pI is available under Creative Commons Attribution-NoDerivs license, for more details see here
| Reference: Kozlowski LP. Proteome-pI 2.0: Proteome Isoelectric Point Database Update. Nucleic Acids Res. 2021, doi: 10.1093/nar/gkab944 | Contact: Lukasz P. Kozlowski |
