Elderberry carlavirus E
Taxonomy: Viruses; Riboviria; Orthornavirae; Kitrinoviricota; Alsuviricetes; Tymovirales; Betaflexiviridae; Quinvirinae; Carlavirus; Sambucus virus E
Average proteome isoelectric point is 7.18
Get precalculated fractions of proteins

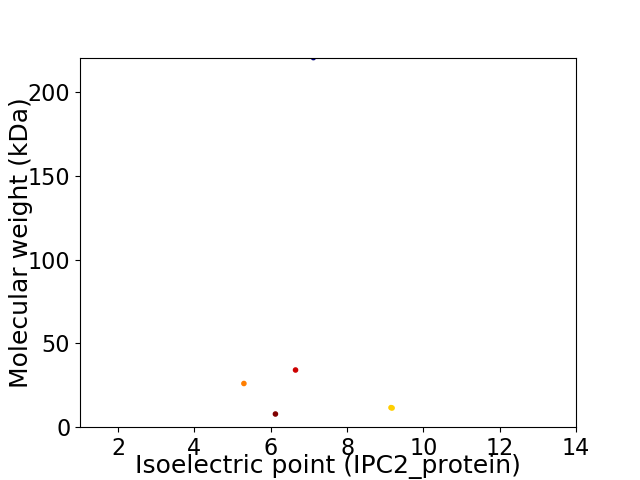
Virtual 2D-PAGE plot for 6 proteins (isoelectric point calculated using IPC2_protein)
Get csv file with sequences according to given criteria:
* You can choose from 21 different methods for calculating isoelectric point
Summary statistics related to proteome-wise predictions


Protein with the lowest isoelectric point:
>tr|A0A0A7M929|A0A0A7M929_9VIRU Helicase OS=Elderberry carlavirus E OX=1569056 PE=3 SV=2
MM1 pKa = 8.07DD2 pKa = 6.14IIIEE6 pKa = 4.06LAEE9 pKa = 3.82QYY11 pKa = 10.93GFQRR15 pKa = 11.84TKK17 pKa = 10.98SKK19 pKa = 10.52LVKK22 pKa = 9.82PLVFHH27 pKa = 6.6CVPGAGKK34 pKa = 8.48STFIRR39 pKa = 11.84LLLAEE44 pKa = 4.6IPGSKK49 pKa = 10.49AFTHH53 pKa = 6.62GVADD57 pKa = 3.91TPTICGLYY65 pKa = 9.95IRR67 pKa = 11.84DD68 pKa = 3.9AKK70 pKa = 10.94DD71 pKa = 2.94IEE73 pKa = 4.48LTSSGSALLLDD84 pKa = 4.88EE85 pKa = 4.17YY86 pKa = 11.11TEE88 pKa = 4.39FEE90 pKa = 4.44EE91 pKa = 6.15LPTHH95 pKa = 6.05TLAAFGDD102 pKa = 4.07PLQSNKK108 pKa = 9.83YY109 pKa = 9.9APRR112 pKa = 11.84EE113 pKa = 3.66PHH115 pKa = 7.02FISDD119 pKa = 3.71LTRR122 pKa = 11.84RR123 pKa = 11.84FGNQTVLLLKK133 pKa = 10.72SLGFNVRR140 pKa = 11.84TEE142 pKa = 4.02KK143 pKa = 10.8VDD145 pKa = 3.55TVVVEE150 pKa = 4.82DD151 pKa = 4.56IYY153 pKa = 11.51AGEE156 pKa = 4.21PEE158 pKa = 4.26GQILCNEE165 pKa = 4.24RR166 pKa = 11.84EE167 pKa = 4.3VAALLCAHH175 pKa = 6.14QLDD178 pKa = 4.59YY179 pKa = 11.73LFVDD183 pKa = 3.65QLRR186 pKa = 11.84GRR188 pKa = 11.84TFDD191 pKa = 2.89KK192 pKa = 10.02VTYY195 pKa = 8.63ITAEE199 pKa = 3.86NSPSDD204 pKa = 3.26RR205 pKa = 11.84VGSFQCLTRR214 pKa = 11.84HH215 pKa = 4.43TTKK218 pKa = 10.9LKK220 pKa = 10.33ILCPDD225 pKa = 3.18ATYY228 pKa = 11.02GPAEE232 pKa = 4.18LFF234 pKa = 3.75
MM1 pKa = 8.07DD2 pKa = 6.14IIIEE6 pKa = 4.06LAEE9 pKa = 3.82QYY11 pKa = 10.93GFQRR15 pKa = 11.84TKK17 pKa = 10.98SKK19 pKa = 10.52LVKK22 pKa = 9.82PLVFHH27 pKa = 6.6CVPGAGKK34 pKa = 8.48STFIRR39 pKa = 11.84LLLAEE44 pKa = 4.6IPGSKK49 pKa = 10.49AFTHH53 pKa = 6.62GVADD57 pKa = 3.91TPTICGLYY65 pKa = 9.95IRR67 pKa = 11.84DD68 pKa = 3.9AKK70 pKa = 10.94DD71 pKa = 2.94IEE73 pKa = 4.48LTSSGSALLLDD84 pKa = 4.88EE85 pKa = 4.17YY86 pKa = 11.11TEE88 pKa = 4.39FEE90 pKa = 4.44EE91 pKa = 6.15LPTHH95 pKa = 6.05TLAAFGDD102 pKa = 4.07PLQSNKK108 pKa = 9.83YY109 pKa = 9.9APRR112 pKa = 11.84EE113 pKa = 3.66PHH115 pKa = 7.02FISDD119 pKa = 3.71LTRR122 pKa = 11.84RR123 pKa = 11.84FGNQTVLLLKK133 pKa = 10.72SLGFNVRR140 pKa = 11.84TEE142 pKa = 4.02KK143 pKa = 10.8VDD145 pKa = 3.55TVVVEE150 pKa = 4.82DD151 pKa = 4.56IYY153 pKa = 11.51AGEE156 pKa = 4.21PEE158 pKa = 4.26GQILCNEE165 pKa = 4.24RR166 pKa = 11.84EE167 pKa = 4.3VAALLCAHH175 pKa = 6.14QLDD178 pKa = 4.59YY179 pKa = 11.73LFVDD183 pKa = 3.65QLRR186 pKa = 11.84GRR188 pKa = 11.84TFDD191 pKa = 2.89KK192 pKa = 10.02VTYY195 pKa = 8.63ITAEE199 pKa = 3.86NSPSDD204 pKa = 3.26RR205 pKa = 11.84VGSFQCLTRR214 pKa = 11.84HH215 pKa = 4.43TTKK218 pKa = 10.9LKK220 pKa = 10.33ILCPDD225 pKa = 3.18ATYY228 pKa = 11.02GPAEE232 pKa = 4.18LFF234 pKa = 3.75
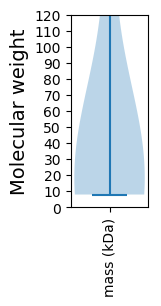
Molecular weight: 26.06 kDa
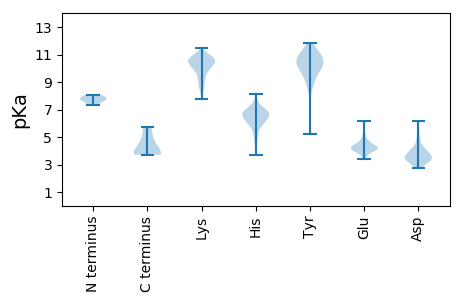
Isoelectric point according different methods:
Protein with the highest isoelectric point:
>tr|A0A0U4KJC8|A0A0U4KJC8_9VIRU Capsid protein OS=Elderberry carlavirus E OX=1569056 PE=3 SV=1
MM1 pKa = 7.33GRR3 pKa = 11.84DD4 pKa = 3.15RR5 pKa = 11.84LTTLFLTIQACDD17 pKa = 3.12AFIPMDD23 pKa = 3.8LCVYY27 pKa = 9.93ILSKK31 pKa = 10.74SKK33 pKa = 10.72PPLCTGGSSTYY44 pKa = 10.13ARR46 pKa = 11.84KK47 pKa = 9.68RR48 pKa = 11.84RR49 pKa = 11.84ARR51 pKa = 11.84KK52 pKa = 9.15IGRR55 pKa = 11.84CWRR58 pKa = 11.84CFRR61 pKa = 11.84VSPPIFSSKK70 pKa = 10.74CNGSTCEE77 pKa = 4.47PGISYY82 pKa = 10.0NWRR85 pKa = 11.84VAEE88 pKa = 4.43FINRR92 pKa = 11.84GVTEE96 pKa = 4.41VIPRR100 pKa = 11.84MM101 pKa = 3.8
MM1 pKa = 7.33GRR3 pKa = 11.84DD4 pKa = 3.15RR5 pKa = 11.84LTTLFLTIQACDD17 pKa = 3.12AFIPMDD23 pKa = 3.8LCVYY27 pKa = 9.93ILSKK31 pKa = 10.74SKK33 pKa = 10.72PPLCTGGSSTYY44 pKa = 10.13ARR46 pKa = 11.84KK47 pKa = 9.68RR48 pKa = 11.84RR49 pKa = 11.84ARR51 pKa = 11.84KK52 pKa = 9.15IGRR55 pKa = 11.84CWRR58 pKa = 11.84CFRR61 pKa = 11.84VSPPIFSSKK70 pKa = 10.74CNGSTCEE77 pKa = 4.47PGISYY82 pKa = 10.0NWRR85 pKa = 11.84VAEE88 pKa = 4.43FINRR92 pKa = 11.84GVTEE96 pKa = 4.41VIPRR100 pKa = 11.84MM101 pKa = 3.8
Molecular weight: 11.46 kDa
Isoelectric point according different methods:
Peptides (in silico digests for buttom-up proteomics)
Below you can find in silico digests of the whole proteome with Trypsin, Chymotrypsin, Trypsin+LysC, LysN, ArgC proteases suitable for different mass spec machines.| Try ESI |
 |
|---|
| ChTry ESI |
 |
|---|
| ArgC ESI |
 |
|---|
| LysN ESI |
 |
|---|
| TryLysC ESI |
 |
|---|
| Try MALDI |
 |
|---|
| ChTry MALDI |
 |
|---|
| ArgC MALDI |
 |
|---|
| LysN MALDI |
 |
|---|
| TryLysC MALDI |
 |
|---|
| Try LTQ |
 |
|---|
| ChTry LTQ |
 |
|---|
| ArgC LTQ |
 |
|---|
| LysN LTQ |
 |
|---|
| TryLysC LTQ |
 |
|---|
| Try MSlow |
 |
|---|
| ChTry MSlow |
 |
|---|
| ArgC MSlow |
 |
|---|
| LysN MSlow |
 |
|---|
| TryLysC MSlow |
 |
|---|
| Try MShigh |
 |
|---|
| ChTry MShigh |
 |
|---|
| ArgC MShigh |
 |
|---|
| LysN MShigh |
 |
|---|
| TryLysC MShigh |
 |
|---|
General Statistics
Number of major isoforms |
Number of additional isoforms |
Number of all proteins |
Number of amino acids |
Min. Seq. Length |
Max. Seq. Length |
Avg. Seq. Length |
Avg. Mol. Weight |
|---|---|---|---|---|---|---|---|
0 |
2782 |
74 |
1958 |
463.7 |
51.94 |
Amino acid frequency
Ala |
Cys |
Asp |
Glu |
Phe |
Gly |
His |
Ile |
Lys |
Leu |
|---|---|---|---|---|---|---|---|---|---|
8.231 ± 0.561 | 2.48 ± 0.726 |
4.817 ± 0.572 | 6.398 ± 1.139 |
4.745 ± 0.521 | 6.075 ± 0.408 |
2.876 ± 0.298 | 6.003 ± 0.556 |
5.931 ± 0.814 | 10.712 ± 1.166 |
Met |
Asn |
Gln |
Pro |
Arg |
Ser |
Thr |
Val |
Trp |
Tyr |
|---|---|---|---|---|---|---|---|---|---|
1.869 ± 0.338 | 3.595 ± 0.406 |
5.14 ± 0.897 | 2.372 ± 0.262 |
5.967 ± 0.687 | 7.009 ± 0.566 |
6.039 ± 0.567 | 5.284 ± 0.423 |
0.971 ± 0.17 | 3.487 ± 0.314 |
Most of the basic statistics you can see at this page can be downloaded from this CSV file
Proteome-pI is available under Creative Commons Attribution-NoDerivs license, for more details see here
| Reference: Kozlowski LP. Proteome-pI 2.0: Proteome Isoelectric Point Database Update. Nucleic Acids Res. 2021, doi: 10.1093/nar/gkab944 | Contact: Lukasz P. Kozlowski |
