Mycobacterium phage Cain
Taxonomy: Viruses; Duplodnaviria; Heunggongvirae; Uroviricota; Caudoviricetes; Caudovirales; Siphoviridae; Timquatrovirus; unclassified Timquatrovirus
Average proteome isoelectric point is 6.06
Get precalculated fractions of proteins

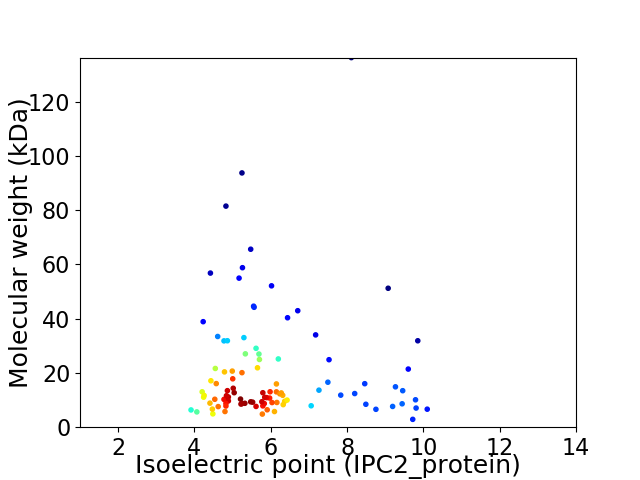
Virtual 2D-PAGE plot for 100 proteins (isoelectric point calculated using IPC2_protein)
Get csv file with sequences according to given criteria:
* You can choose from 21 different methods for calculating isoelectric point
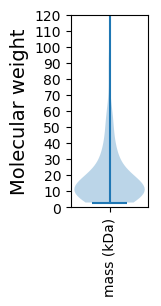
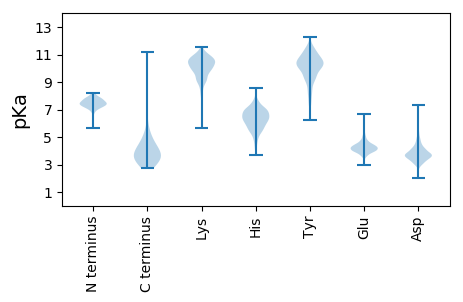
Summary statistics related to proteome-wise predictions


Protein with the lowest isoelectric point:
>tr|A0A222ZLY5|A0A222ZLY5_9CAUD Uncharacterized protein OS=Mycobacterium phage Cain OX=2015818 GN=89 PE=4 SV=1
MM1 pKa = 7.53EE2 pKa = 5.35APSTIEE8 pKa = 4.15VPCPACGEE16 pKa = 4.49PIVLSIGFEE25 pKa = 4.21VAVPEE30 pKa = 4.73PGADD34 pKa = 3.28SAPVYY39 pKa = 9.59VTTPDD44 pKa = 3.49LADD47 pKa = 3.8RR48 pKa = 11.84AQAHH52 pKa = 6.24GEE54 pKa = 4.2VCPVLAGGGCC64 pKa = 3.37
MM1 pKa = 7.53EE2 pKa = 5.35APSTIEE8 pKa = 4.15VPCPACGEE16 pKa = 4.49PIVLSIGFEE25 pKa = 4.21VAVPEE30 pKa = 4.73PGADD34 pKa = 3.28SAPVYY39 pKa = 9.59VTTPDD44 pKa = 3.49LADD47 pKa = 3.8RR48 pKa = 11.84AQAHH52 pKa = 6.24GEE54 pKa = 4.2VCPVLAGGGCC64 pKa = 3.37
Molecular weight: 6.36 kDa
Isoelectric point according different methods:
Protein with the highest isoelectric point:
>tr|A0A222ZMU6|A0A222ZMU6_9CAUD 3'-phosphate/5'-hydroxy nucleic acid ligase OS=Mycobacterium phage Cain OX=2015818 GN=92 PE=3 SV=1
MM1 pKa = 7.43TSTARR6 pKa = 11.84HH7 pKa = 5.62MSPAQARR14 pKa = 11.84AITLNLLRR22 pKa = 11.84DD23 pKa = 3.6HH24 pKa = 7.1GLTGWSVRR32 pKa = 11.84YY33 pKa = 10.17DD34 pKa = 3.43NARR37 pKa = 11.84RR38 pKa = 11.84RR39 pKa = 11.84AGMCSYY45 pKa = 10.58RR46 pKa = 11.84EE47 pKa = 4.0RR48 pKa = 11.84VISLSKK54 pKa = 10.43PLMAQRR60 pKa = 11.84SYY62 pKa = 11.79DD63 pKa = 4.03DD64 pKa = 2.73TWMTITHH71 pKa = 7.33EE72 pKa = 4.07IAHH75 pKa = 6.4ALVGPSHH82 pKa = 6.24GHH84 pKa = 5.99DD85 pKa = 3.56AVWSAKK91 pKa = 9.5HH92 pKa = 6.04RR93 pKa = 11.84SLGGDD98 pKa = 3.53GKK100 pKa = 11.04RR101 pKa = 11.84CFEE104 pKa = 4.85HH105 pKa = 8.54LDD107 pKa = 3.63EE108 pKa = 4.72SAPWMGTCAHH118 pKa = 7.05GKK120 pKa = 9.03QFARR124 pKa = 11.84YY125 pKa = 7.48RR126 pKa = 11.84APKK129 pKa = 9.0QLHH132 pKa = 5.48GWRR135 pKa = 11.84CRR137 pKa = 11.84CVRR140 pKa = 11.84GGSPITWQTRR150 pKa = 11.84EE151 pKa = 3.77QRR153 pKa = 11.84EE154 pKa = 3.85TMAAVVAQAQARR166 pKa = 11.84RR167 pKa = 11.84AQPRR171 pKa = 11.84RR172 pKa = 11.84VEE174 pKa = 4.29PLTSAPVGRR183 pKa = 11.84GVQLDD188 pKa = 3.84LFF190 pKa = 4.6
MM1 pKa = 7.43TSTARR6 pKa = 11.84HH7 pKa = 5.62MSPAQARR14 pKa = 11.84AITLNLLRR22 pKa = 11.84DD23 pKa = 3.6HH24 pKa = 7.1GLTGWSVRR32 pKa = 11.84YY33 pKa = 10.17DD34 pKa = 3.43NARR37 pKa = 11.84RR38 pKa = 11.84RR39 pKa = 11.84AGMCSYY45 pKa = 10.58RR46 pKa = 11.84EE47 pKa = 4.0RR48 pKa = 11.84VISLSKK54 pKa = 10.43PLMAQRR60 pKa = 11.84SYY62 pKa = 11.79DD63 pKa = 4.03DD64 pKa = 2.73TWMTITHH71 pKa = 7.33EE72 pKa = 4.07IAHH75 pKa = 6.4ALVGPSHH82 pKa = 6.24GHH84 pKa = 5.99DD85 pKa = 3.56AVWSAKK91 pKa = 9.5HH92 pKa = 6.04RR93 pKa = 11.84SLGGDD98 pKa = 3.53GKK100 pKa = 11.04RR101 pKa = 11.84CFEE104 pKa = 4.85HH105 pKa = 8.54LDD107 pKa = 3.63EE108 pKa = 4.72SAPWMGTCAHH118 pKa = 7.05GKK120 pKa = 9.03QFARR124 pKa = 11.84YY125 pKa = 7.48RR126 pKa = 11.84APKK129 pKa = 9.0QLHH132 pKa = 5.48GWRR135 pKa = 11.84CRR137 pKa = 11.84CVRR140 pKa = 11.84GGSPITWQTRR150 pKa = 11.84EE151 pKa = 3.77QRR153 pKa = 11.84EE154 pKa = 3.85TMAAVVAQAQARR166 pKa = 11.84RR167 pKa = 11.84AQPRR171 pKa = 11.84RR172 pKa = 11.84VEE174 pKa = 4.29PLTSAPVGRR183 pKa = 11.84GVQLDD188 pKa = 3.84LFF190 pKa = 4.6
Molecular weight: 21.43 kDa
Isoelectric point according different methods:
Peptides (in silico digests for buttom-up proteomics)
Below you can find in silico digests of the whole proteome with Trypsin, Chymotrypsin, Trypsin+LysC, LysN, ArgC proteases suitable for different mass spec machines.| Try ESI |
 |
|---|
| ChTry ESI |
 |
|---|
| ArgC ESI |
 |
|---|
| LysN ESI |
 |
|---|
| TryLysC ESI |
 |
|---|
| Try MALDI |
 |
|---|
| ChTry MALDI |
 |
|---|
| ArgC MALDI |
 |
|---|
| LysN MALDI |
 |
|---|
| TryLysC MALDI |
 |
|---|
| Try LTQ |
 |
|---|
| ChTry LTQ |
 |
|---|
| ArgC LTQ |
 |
|---|
| LysN LTQ |
 |
|---|
| TryLysC LTQ |
 |
|---|
| Try MSlow |
 |
|---|
| ChTry MSlow |
 |
|---|
| ArgC MSlow |
 |
|---|
| LysN MSlow |
 |
|---|
| TryLysC MSlow |
 |
|---|
| Try MShigh |
 |
|---|
| ChTry MShigh |
 |
|---|
| ArgC MShigh |
 |
|---|
| LysN MShigh |
 |
|---|
| TryLysC MShigh |
 |
|---|
General Statistics
Number of major isoforms |
Number of additional isoforms |
Number of all proteins |
Number of amino acids |
Min. Seq. Length |
Max. Seq. Length |
Avg. Seq. Length |
Avg. Mol. Weight |
|---|---|---|---|---|---|---|---|
0 |
18802 |
28 |
1333 |
188.0 |
20.35 |
Amino acid frequency
Ala |
Cys |
Asp |
Glu |
Phe |
Gly |
His |
Ile |
Lys |
Leu |
|---|---|---|---|---|---|---|---|---|---|
13.073 ± 0.479 | 1.122 ± 0.143 |
6.595 ± 0.27 | 5.691 ± 0.303 |
2.617 ± 0.141 | 8.925 ± 0.419 |
2.314 ± 0.177 | 3.808 ± 0.157 |
3.228 ± 0.164 | 8.393 ± 0.226 |
Met |
Asn |
Gln |
Pro |
Arg |
Ser |
Thr |
Val |
Trp |
Tyr |
|---|---|---|---|---|---|---|---|---|---|
2.149 ± 0.101 | 2.856 ± 0.152 |
5.781 ± 0.227 | 3.159 ± 0.161 |
7.111 ± 0.339 | 5.015 ± 0.188 |
5.733 ± 0.194 | 7.919 ± 0.223 |
2.138 ± 0.097 | 2.372 ± 0.16 |
Most of the basic statistics you can see at this page can be downloaded from this CSV file
Proteome-pI is available under Creative Commons Attribution-NoDerivs license, for more details see here
| Reference: Kozlowski LP. Proteome-pI 2.0: Proteome Isoelectric Point Database Update. Nucleic Acids Res. 2021, doi: 10.1093/nar/gkab944 | Contact: Lukasz P. Kozlowski |
