Enterobacteria phage 2851
Taxonomy: Viruses; Duplodnaviria; Heunggongvirae; Uroviricota; Caudoviricetes; Caudovirales; Siphoviridae; Pankowvirus; Enterobacteria virus 2851
Average proteome isoelectric point is 6.92
Get precalculated fractions of proteins

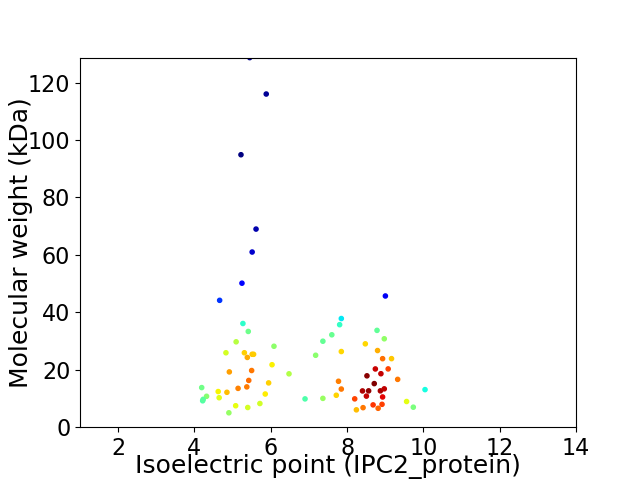
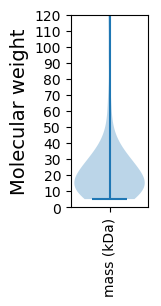
Virtual 2D-PAGE plot for 75 proteins (isoelectric point calculated using IPC2_protein)
Get csv file with sequences according to given criteria:
* You can choose from 21 different methods for calculating isoelectric point
Summary statistics related to proteome-wise predictions


Protein with the lowest isoelectric point:
>tr|B6ETB1|B6ETB1_9CAUD Putative anti-termination protein N OS=Enterobacteria phage 2851 OX=254397 GN=antN PE=4 SV=1
MM1 pKa = 7.62EE2 pKa = 4.36FHH4 pKa = 7.21EE5 pKa = 5.34SAICDD10 pKa = 3.52FRR12 pKa = 11.84ANANSVKK19 pKa = 9.25PQPIAVLFKK28 pKa = 10.94TMGAWAVLCFAADD41 pKa = 3.61DD42 pKa = 3.83TDD44 pKa = 3.42ARR46 pKa = 11.84MAIGQEE52 pKa = 4.02MEE54 pKa = 3.99MDD56 pKa = 3.55PTNDD60 pKa = 2.86EE61 pKa = 4.58FIIYY65 pKa = 7.71GAPSNYY71 pKa = 10.43LLDD74 pKa = 3.47TCNIYY79 pKa = 10.99NKK81 pKa = 10.37AAA83 pKa = 3.64
MM1 pKa = 7.62EE2 pKa = 4.36FHH4 pKa = 7.21EE5 pKa = 5.34SAICDD10 pKa = 3.52FRR12 pKa = 11.84ANANSVKK19 pKa = 9.25PQPIAVLFKK28 pKa = 10.94TMGAWAVLCFAADD41 pKa = 3.61DD42 pKa = 3.83TDD44 pKa = 3.42ARR46 pKa = 11.84MAIGQEE52 pKa = 4.02MEE54 pKa = 3.99MDD56 pKa = 3.55PTNDD60 pKa = 2.86EE61 pKa = 4.58FIIYY65 pKa = 7.71GAPSNYY71 pKa = 10.43LLDD74 pKa = 3.47TCNIYY79 pKa = 10.99NKK81 pKa = 10.37AAA83 pKa = 3.64
Molecular weight: 9.2 kDa
Isoelectric point according different methods:
Protein with the highest isoelectric point:
>tr|B6ETF3|B6ETF3_9CAUD Uncharacterized protein OS=Enterobacteria phage 2851 OX=254397 GN=EP2851_58 PE=4 SV=1
MM1 pKa = 7.8IEE3 pKa = 4.08TLLDD7 pKa = 3.78FSGLEE12 pKa = 4.36DD13 pKa = 3.89ISRR16 pKa = 11.84DD17 pKa = 3.57LQLLSGAEE25 pKa = 3.95NNRR28 pKa = 11.84VLRR31 pKa = 11.84EE32 pKa = 4.01ATRR35 pKa = 11.84AGANVLKK42 pKa = 10.7EE43 pKa = 4.32EE44 pKa = 4.45VVSRR48 pKa = 11.84APVRR52 pKa = 11.84RR53 pKa = 11.84GKK55 pKa = 10.28LRR57 pKa = 11.84RR58 pKa = 11.84NVVVLSRR65 pKa = 11.84RR66 pKa = 11.84SRR68 pKa = 11.84DD69 pKa = 3.03GGMEE73 pKa = 4.05SGVHH77 pKa = 4.84IRR79 pKa = 11.84GVNPDD84 pKa = 3.81TGNSDD89 pKa = 3.26NTMKK93 pKa = 10.84ADD95 pKa = 3.51NPRR98 pKa = 11.84NAFYY102 pKa = 10.46WRR104 pKa = 11.84FVEE107 pKa = 4.15MGTVNMPPHH116 pKa = 6.68PFVRR120 pKa = 11.84PAFDD124 pKa = 3.27VRR126 pKa = 11.84SEE128 pKa = 3.89QAAQVAIARR137 pKa = 11.84MNRR140 pKa = 11.84AIDD143 pKa = 3.53EE144 pKa = 4.28VLRR147 pKa = 11.84RR148 pKa = 3.79
MM1 pKa = 7.8IEE3 pKa = 4.08TLLDD7 pKa = 3.78FSGLEE12 pKa = 4.36DD13 pKa = 3.89ISRR16 pKa = 11.84DD17 pKa = 3.57LQLLSGAEE25 pKa = 3.95NNRR28 pKa = 11.84VLRR31 pKa = 11.84EE32 pKa = 4.01ATRR35 pKa = 11.84AGANVLKK42 pKa = 10.7EE43 pKa = 4.32EE44 pKa = 4.45VVSRR48 pKa = 11.84APVRR52 pKa = 11.84RR53 pKa = 11.84GKK55 pKa = 10.28LRR57 pKa = 11.84RR58 pKa = 11.84NVVVLSRR65 pKa = 11.84RR66 pKa = 11.84SRR68 pKa = 11.84DD69 pKa = 3.03GGMEE73 pKa = 4.05SGVHH77 pKa = 4.84IRR79 pKa = 11.84GVNPDD84 pKa = 3.81TGNSDD89 pKa = 3.26NTMKK93 pKa = 10.84ADD95 pKa = 3.51NPRR98 pKa = 11.84NAFYY102 pKa = 10.46WRR104 pKa = 11.84FVEE107 pKa = 4.15MGTVNMPPHH116 pKa = 6.68PFVRR120 pKa = 11.84PAFDD124 pKa = 3.27VRR126 pKa = 11.84SEE128 pKa = 3.89QAAQVAIARR137 pKa = 11.84MNRR140 pKa = 11.84AIDD143 pKa = 3.53EE144 pKa = 4.28VLRR147 pKa = 11.84RR148 pKa = 3.79
Molecular weight: 16.66 kDa
Isoelectric point according different methods:
Peptides (in silico digests for buttom-up proteomics)
Below you can find in silico digests of the whole proteome with Trypsin, Chymotrypsin, Trypsin+LysC, LysN, ArgC proteases suitable for different mass spec machines.| Try ESI |
 |
|---|
| ChTry ESI |
 |
|---|
| ArgC ESI |
 |
|---|
| LysN ESI |
 |
|---|
| TryLysC ESI |
 |
|---|
| Try MALDI |
 |
|---|
| ChTry MALDI |
 |
|---|
| ArgC MALDI |
 |
|---|
| LysN MALDI |
 |
|---|
| TryLysC MALDI |
 |
|---|
| Try LTQ |
 |
|---|
| ChTry LTQ |
 |
|---|
| ArgC LTQ |
 |
|---|
| LysN LTQ |
 |
|---|
| TryLysC LTQ |
 |
|---|
| Try MSlow |
 |
|---|
| ChTry MSlow |
 |
|---|
| ArgC MSlow |
 |
|---|
| LysN MSlow |
 |
|---|
| TryLysC MSlow |
 |
|---|
| Try MShigh |
 |
|---|
| ChTry MShigh |
 |
|---|
| ArgC MShigh |
 |
|---|
| LysN MShigh |
 |
|---|
| TryLysC MShigh |
 |
|---|
General Statistics
Number of major isoforms |
Number of additional isoforms |
Number of all proteins |
Number of amino acids |
Min. Seq. Length |
Max. Seq. Length |
Avg. Seq. Length |
Avg. Mol. Weight |
|---|---|---|---|---|---|---|---|
0 |
16116 |
44 |
1184 |
214.9 |
23.88 |
Amino acid frequency
Ala |
Cys |
Asp |
Glu |
Phe |
Gly |
His |
Ile |
Lys |
Leu |
|---|---|---|---|---|---|---|---|---|---|
9.574 ± 0.515 | 1.353 ± 0.16 |
5.585 ± 0.197 | 6.608 ± 0.303 |
3.245 ± 0.163 | 7.179 ± 0.358 |
1.967 ± 0.151 | 5.355 ± 0.248 |
5.287 ± 0.258 | 8.197 ± 0.269 |
Met |
Asn |
Gln |
Pro |
Arg |
Ser |
Thr |
Val |
Trp |
Tyr |
|---|---|---|---|---|---|---|---|---|---|
2.755 ± 0.172 | 4.219 ± 0.205 |
4.151 ± 0.281 | 4.337 ± 0.269 |
6.714 ± 0.286 | 6.943 ± 0.237 |
5.684 ± 0.326 | 6.515 ± 0.238 |
1.651 ± 0.138 | 2.681 ± 0.146 |
Most of the basic statistics you can see at this page can be downloaded from this CSV file
Proteome-pI is available under Creative Commons Attribution-NoDerivs license, for more details see here
| Reference: Kozlowski LP. Proteome-pI 2.0: Proteome Isoelectric Point Database Update. Nucleic Acids Res. 2021, doi: 10.1093/nar/gkab944 | Contact: Lukasz P. Kozlowski |
