Candidatus Nitrospira nitrificans
Taxonomy: cellular organisms; Bacteria; Nitrospirae; Nitrospira; Nitrospirales; Nitrospiraceae; Nitrospira
Average proteome isoelectric point is 7.01
Get precalculated fractions of proteins

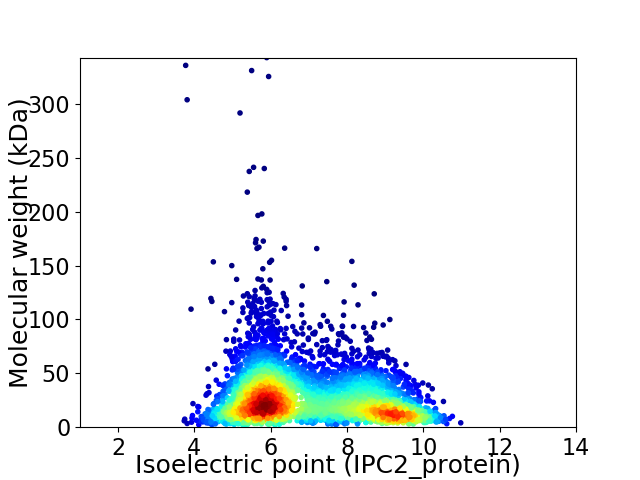
Virtual 2D-PAGE plot for 4434 proteins (isoelectric point calculated using IPC2_protein)
Get csv file with sequences according to given criteria:
* You can choose from 21 different methods for calculating isoelectric point
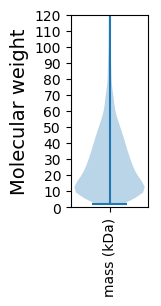
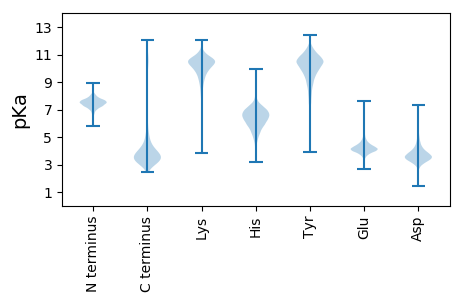
Summary statistics related to proteome-wise predictions


Protein with the lowest isoelectric point:
>tr|A0A0S4LGJ7|A0A0S4LGJ7_9BACT Uncharacterized protein OS=Candidatus Nitrospira nitrificans OX=1742973 GN=COMA2_20099 PE=4 SV=1
MM1 pKa = 7.69DD2 pKa = 4.86RR3 pKa = 11.84SMVATAWEE11 pKa = 4.02QHH13 pKa = 6.09CAIGWPQFASPHH25 pKa = 5.57QGQLMTIDD33 pKa = 3.98TVISGCVVYY42 pKa = 11.01YY43 pKa = 10.71LDD45 pKa = 5.34SSDD48 pKa = 4.59GLDD51 pKa = 3.63DD52 pKa = 3.53QRR54 pKa = 11.84VAIVKK59 pKa = 10.21DD60 pKa = 3.53CLGDD64 pKa = 3.81LDD66 pKa = 5.0EE67 pKa = 4.91LTEE70 pKa = 4.16TLDD73 pKa = 4.11TEE75 pKa = 4.22SQTYY79 pKa = 8.35FFRR82 pKa = 11.84LRR84 pKa = 11.84EE85 pKa = 4.2LGAMLLGDD93 pKa = 4.38EE94 pKa = 4.72PLSS97 pKa = 3.8
MM1 pKa = 7.69DD2 pKa = 4.86RR3 pKa = 11.84SMVATAWEE11 pKa = 4.02QHH13 pKa = 6.09CAIGWPQFASPHH25 pKa = 5.57QGQLMTIDD33 pKa = 3.98TVISGCVVYY42 pKa = 11.01YY43 pKa = 10.71LDD45 pKa = 5.34SSDD48 pKa = 4.59GLDD51 pKa = 3.63DD52 pKa = 3.53QRR54 pKa = 11.84VAIVKK59 pKa = 10.21DD60 pKa = 3.53CLGDD64 pKa = 3.81LDD66 pKa = 5.0EE67 pKa = 4.91LTEE70 pKa = 4.16TLDD73 pKa = 4.11TEE75 pKa = 4.22SQTYY79 pKa = 8.35FFRR82 pKa = 11.84LRR84 pKa = 11.84EE85 pKa = 4.2LGAMLLGDD93 pKa = 4.38EE94 pKa = 4.72PLSS97 pKa = 3.8
Molecular weight: 10.83 kDa
Isoelectric point according different methods:
Protein with the highest isoelectric point:
>tr|A0A0S4L703|A0A0S4L703_9BACT Putative Glutamate-ammonia-ligase adenylyltransferase subunit A OS=Candidatus Nitrospira nitrificans OX=1742973 GN=COMA2_100082 PE=4 SV=1
MM1 pKa = 6.96TARR4 pKa = 11.84AADD7 pKa = 3.63NSQLEE12 pKa = 4.51GNCAVLIGTLSVCPSTRR29 pKa = 11.84VCRR32 pKa = 11.84SSSRR36 pKa = 11.84MAAPRR41 pKa = 11.84PSRR44 pKa = 11.84NRR46 pKa = 11.84SASGRR51 pKa = 11.84TAASPLLKK59 pKa = 10.35RR60 pKa = 11.84SWSGMTITISPFTCSTMRR78 pKa = 11.84TRR80 pKa = 11.84DD81 pKa = 3.07ICGTPLMTCTRR92 pKa = 11.84LRR94 pKa = 11.84SRR96 pKa = 11.84RR97 pKa = 11.84MATSLLPGVFGAVSAGLLALRR118 pKa = 11.84LNAEE122 pKa = 3.98GDD124 pKa = 3.6EE125 pKa = 4.53GGVTIGLRR133 pKa = 11.84AALIDD138 pKa = 4.05SLTVRR143 pKa = 11.84YY144 pKa = 9.05FPTLTEE150 pKa = 4.33EE151 pKa = 3.95IEE153 pKa = 4.44YY154 pKa = 8.81ITTKK158 pKa = 10.4NANNKK163 pKa = 7.75VMKK166 pKa = 9.99SAYY169 pKa = 6.57EE170 pKa = 3.87TSHH173 pKa = 7.02RR174 pKa = 11.84SS175 pKa = 3.12
MM1 pKa = 6.96TARR4 pKa = 11.84AADD7 pKa = 3.63NSQLEE12 pKa = 4.51GNCAVLIGTLSVCPSTRR29 pKa = 11.84VCRR32 pKa = 11.84SSSRR36 pKa = 11.84MAAPRR41 pKa = 11.84PSRR44 pKa = 11.84NRR46 pKa = 11.84SASGRR51 pKa = 11.84TAASPLLKK59 pKa = 10.35RR60 pKa = 11.84SWSGMTITISPFTCSTMRR78 pKa = 11.84TRR80 pKa = 11.84DD81 pKa = 3.07ICGTPLMTCTRR92 pKa = 11.84LRR94 pKa = 11.84SRR96 pKa = 11.84RR97 pKa = 11.84MATSLLPGVFGAVSAGLLALRR118 pKa = 11.84LNAEE122 pKa = 3.98GDD124 pKa = 3.6EE125 pKa = 4.53GGVTIGLRR133 pKa = 11.84AALIDD138 pKa = 4.05SLTVRR143 pKa = 11.84YY144 pKa = 9.05FPTLTEE150 pKa = 4.33EE151 pKa = 3.95IEE153 pKa = 4.44YY154 pKa = 8.81ITTKK158 pKa = 10.4NANNKK163 pKa = 7.75VMKK166 pKa = 9.99SAYY169 pKa = 6.57EE170 pKa = 3.87TSHH173 pKa = 7.02RR174 pKa = 11.84SS175 pKa = 3.12
Molecular weight: 18.79 kDa
Isoelectric point according different methods:
Peptides (in silico digests for buttom-up proteomics)
Below you can find in silico digests of the whole proteome with Trypsin, Chymotrypsin, Trypsin+LysC, LysN, ArgC proteases suitable for different mass spec machines.| Try ESI |
 |
|---|
| ChTry ESI |
 |
|---|
| ArgC ESI |
 |
|---|
| LysN ESI |
 |
|---|
| TryLysC ESI |
 |
|---|
| Try MALDI |
 |
|---|
| ChTry MALDI |
 |
|---|
| ArgC MALDI |
 |
|---|
| LysN MALDI |
 |
|---|
| TryLysC MALDI |
 |
|---|
| Try LTQ |
 |
|---|
| ChTry LTQ |
 |
|---|
| ArgC LTQ |
 |
|---|
| LysN LTQ |
 |
|---|
| TryLysC LTQ |
 |
|---|
| Try MSlow |
 |
|---|
| ChTry MSlow |
 |
|---|
| ArgC MSlow |
 |
|---|
| LysN MSlow |
 |
|---|
| TryLysC MSlow |
 |
|---|
| Try MShigh |
 |
|---|
| ChTry MShigh |
 |
|---|
| ArgC MShigh |
 |
|---|
| LysN MShigh |
 |
|---|
| TryLysC MShigh |
 |
|---|
General Statistics
Number of major isoforms |
Number of additional isoforms |
Number of all proteins |
Number of amino acids |
Min. Seq. Length |
Max. Seq. Length |
Avg. Seq. Length |
Avg. Mol. Weight |
|---|---|---|---|---|---|---|---|
0 |
1215056 |
20 |
3275 |
274.0 |
30.28 |
Amino acid frequency
Ala |
Cys |
Asp |
Glu |
Phe |
Gly |
His |
Ile |
Lys |
Leu |
|---|---|---|---|---|---|---|---|---|---|
9.501 ± 0.039 | 1.066 ± 0.016 |
5.197 ± 0.03 | 6.063 ± 0.038 |
3.604 ± 0.025 | 7.774 ± 0.049 |
2.466 ± 0.02 | 5.306 ± 0.028 |
4.168 ± 0.042 | 10.388 ± 0.045 |
Met |
Asn |
Gln |
Pro |
Arg |
Ser |
Thr |
Val |
Trp |
Tyr |
|---|---|---|---|---|---|---|---|---|---|
2.463 ± 0.021 | 2.731 ± 0.024 |
5.064 ± 0.03 | 3.934 ± 0.025 |
7.101 ± 0.044 | 6.023 ± 0.03 |
5.698 ± 0.041 | 7.601 ± 0.028 |
1.345 ± 0.019 | 2.508 ± 0.021 |
Most of the basic statistics you can see at this page can be downloaded from this CSV file
Proteome-pI is available under Creative Commons Attribution-NoDerivs license, for more details see here
| Reference: Kozlowski LP. Proteome-pI 2.0: Proteome Isoelectric Point Database Update. Nucleic Acids Res. 2021, doi: 10.1093/nar/gkab944 | Contact: Lukasz P. Kozlowski |
