Dendroctonus ponderosae (Mountain pine beetle)
Taxonomy: cellular organisms; Eukaryota; Opisthokonta; Metazoa; Eumetazoa; Bilateria; Protostomia; Ecdysozoa; Panarthropoda; Arthropoda; Mandibulata; Pancrustacea; Hexapoda; Insecta; Dicondylia; Pterygota; Neoptera; Endopterygota; Coleoptera; Polyphaga; Cucujiformia; Curculionoidea; Curculionidae; Scolytinae;
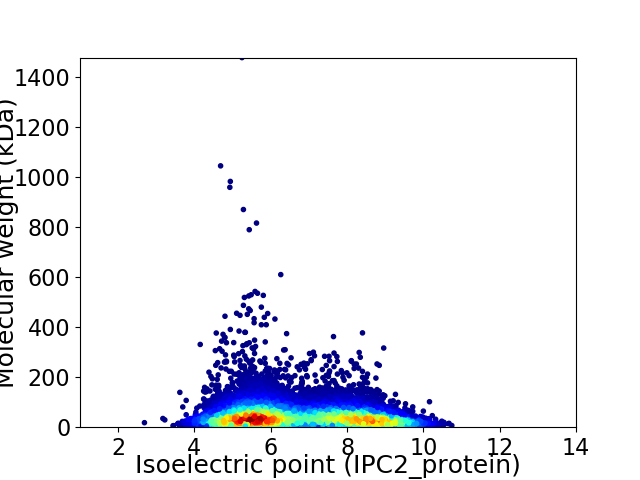
Average proteome isoelectric point is 6.7
Get precalculated fractions of proteins

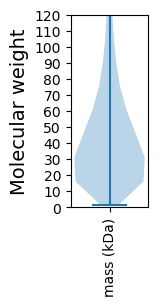
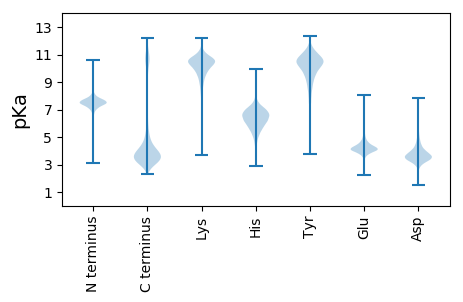
Virtual 2D-PAGE plot for 12251 proteins (isoelectric point calculated using IPC2_protein)
Get csv file with sequences according to given criteria:
* You can choose from 21 different methods for calculating isoelectric point
Summary statistics related to proteome-wise predictions


Protein with the lowest isoelectric point:
>tr|U4UE00|U4UE00_DENPD Myb-like SWIRM and MPN domain-containing protein 1 OS=Dendroctonus ponderosae OX=77166 GN=D910_06198 PE=3 SV=1
MM1 pKa = 7.48FYY3 pKa = 10.33WILILLFAPSLVNTLTCHH21 pKa = 6.21RR22 pKa = 11.84CFGYY26 pKa = 10.34GFCHH30 pKa = 7.5DD31 pKa = 4.92PDD33 pKa = 6.15DD34 pKa = 5.25PDD36 pKa = 4.11FSDD39 pKa = 5.29GIRR42 pKa = 11.84VAACSSWKK50 pKa = 10.52YY51 pKa = 9.05WDD53 pKa = 4.3EE54 pKa = 4.28PLLSDD59 pKa = 4.63DD60 pKa = 3.52PFGRR64 pKa = 11.84RR65 pKa = 11.84VEE67 pKa = 4.0EE68 pKa = 4.12ALNEE72 pKa = 4.11NYY74 pKa = 10.09RR75 pKa = 11.84HH76 pKa = 6.03NFLNSSTQNTQLEE89 pKa = 4.65HH90 pKa = 6.4HH91 pKa = 6.85CVTARR96 pKa = 11.84VHH98 pKa = 4.92EE99 pKa = 4.49TKK101 pKa = 10.69NSYY104 pKa = 7.29TLRR107 pKa = 11.84TCISRR112 pKa = 11.84VVPTDD117 pKa = 2.93QSYY120 pKa = 7.64PTLCEE125 pKa = 4.95LIDD128 pKa = 6.39DD129 pKa = 4.9LTQSQNRR136 pKa = 11.84HH137 pKa = 5.62NGSFSCRR144 pKa = 11.84QCTGDD149 pKa = 3.33FCNTHH154 pKa = 6.91ALQEE158 pKa = 4.4GDD160 pKa = 4.0GVAIDD165 pKa = 5.92DD166 pKa = 5.79DD167 pKa = 6.69DD168 pKa = 7.58DD169 pKa = 7.56DD170 pKa = 7.6DD171 pKa = 7.67DD172 pKa = 7.44DD173 pKa = 5.66DD174 pKa = 5.47TDD176 pKa = 6.4DD177 pKa = 6.64DD178 pKa = 6.57DD179 pKa = 7.84DD180 pKa = 7.67DD181 pKa = 7.56DD182 pKa = 7.61DD183 pKa = 7.73DD184 pKa = 7.59DD185 pKa = 6.71DD186 pKa = 7.23DD187 pKa = 6.46SDD189 pKa = 5.76NEE191 pKa = 4.16TDD193 pKa = 4.27DD194 pKa = 5.45LKK196 pKa = 11.47DD197 pKa = 3.32SASTVTRR204 pKa = 11.84VAFTVLAFCSVSIGLSLFSDD224 pKa = 4.19
MM1 pKa = 7.48FYY3 pKa = 10.33WILILLFAPSLVNTLTCHH21 pKa = 6.21RR22 pKa = 11.84CFGYY26 pKa = 10.34GFCHH30 pKa = 7.5DD31 pKa = 4.92PDD33 pKa = 6.15DD34 pKa = 5.25PDD36 pKa = 4.11FSDD39 pKa = 5.29GIRR42 pKa = 11.84VAACSSWKK50 pKa = 10.52YY51 pKa = 9.05WDD53 pKa = 4.3EE54 pKa = 4.28PLLSDD59 pKa = 4.63DD60 pKa = 3.52PFGRR64 pKa = 11.84RR65 pKa = 11.84VEE67 pKa = 4.0EE68 pKa = 4.12ALNEE72 pKa = 4.11NYY74 pKa = 10.09RR75 pKa = 11.84HH76 pKa = 6.03NFLNSSTQNTQLEE89 pKa = 4.65HH90 pKa = 6.4HH91 pKa = 6.85CVTARR96 pKa = 11.84VHH98 pKa = 4.92EE99 pKa = 4.49TKK101 pKa = 10.69NSYY104 pKa = 7.29TLRR107 pKa = 11.84TCISRR112 pKa = 11.84VVPTDD117 pKa = 2.93QSYY120 pKa = 7.64PTLCEE125 pKa = 4.95LIDD128 pKa = 6.39DD129 pKa = 4.9LTQSQNRR136 pKa = 11.84HH137 pKa = 5.62NGSFSCRR144 pKa = 11.84QCTGDD149 pKa = 3.33FCNTHH154 pKa = 6.91ALQEE158 pKa = 4.4GDD160 pKa = 4.0GVAIDD165 pKa = 5.92DD166 pKa = 5.79DD167 pKa = 6.69DD168 pKa = 7.58DD169 pKa = 7.56DD170 pKa = 7.6DD171 pKa = 7.67DD172 pKa = 7.44DD173 pKa = 5.66DD174 pKa = 5.47TDD176 pKa = 6.4DD177 pKa = 6.64DD178 pKa = 6.57DD179 pKa = 7.84DD180 pKa = 7.67DD181 pKa = 7.56DD182 pKa = 7.61DD183 pKa = 7.73DD184 pKa = 7.59DD185 pKa = 6.71DD186 pKa = 7.23DD187 pKa = 6.46SDD189 pKa = 5.76NEE191 pKa = 4.16TDD193 pKa = 4.27DD194 pKa = 5.45LKK196 pKa = 11.47DD197 pKa = 3.32SASTVTRR204 pKa = 11.84VAFTVLAFCSVSIGLSLFSDD224 pKa = 4.19
Molecular weight: 25.3 kDa
Isoelectric point according different methods:
Protein with the highest isoelectric point:
>tr|U4UHD8|U4UHD8_DENPD Uncharacterized protein OS=Dendroctonus ponderosae OX=77166 GN=D910_09741 PE=4 SV=1
MM1 pKa = 6.95WTYY4 pKa = 9.21QACICPKK11 pKa = 9.89IRR13 pKa = 11.84SCVGKK18 pKa = 9.52WPWASIRR25 pKa = 11.84RR26 pKa = 11.84YY27 pKa = 10.07HH28 pKa = 7.66DD29 pKa = 3.45GGDD32 pKa = 3.76RR33 pKa = 11.84NDD35 pKa = 3.17SRR37 pKa = 11.84ARR39 pKa = 11.84GCAQQPHH46 pKa = 6.93LDD48 pKa = 3.4HH49 pKa = 7.02RR50 pKa = 11.84RR51 pKa = 11.84STFHH55 pKa = 6.86RR56 pKa = 11.84ANRR59 pKa = 11.84PKK61 pKa = 10.69ALEE64 pKa = 4.34DD65 pKa = 3.27RR66 pKa = 11.84SEE68 pKa = 4.07AGKK71 pKa = 10.46CLSVWLSMSRR81 pKa = 11.84LPSNRR86 pKa = 11.84RR87 pKa = 11.84ILQSKK92 pKa = 9.1
MM1 pKa = 6.95WTYY4 pKa = 9.21QACICPKK11 pKa = 9.89IRR13 pKa = 11.84SCVGKK18 pKa = 9.52WPWASIRR25 pKa = 11.84RR26 pKa = 11.84YY27 pKa = 10.07HH28 pKa = 7.66DD29 pKa = 3.45GGDD32 pKa = 3.76RR33 pKa = 11.84NDD35 pKa = 3.17SRR37 pKa = 11.84ARR39 pKa = 11.84GCAQQPHH46 pKa = 6.93LDD48 pKa = 3.4HH49 pKa = 7.02RR50 pKa = 11.84RR51 pKa = 11.84STFHH55 pKa = 6.86RR56 pKa = 11.84ANRR59 pKa = 11.84PKK61 pKa = 10.69ALEE64 pKa = 4.34DD65 pKa = 3.27RR66 pKa = 11.84SEE68 pKa = 4.07AGKK71 pKa = 10.46CLSVWLSMSRR81 pKa = 11.84LPSNRR86 pKa = 11.84RR87 pKa = 11.84ILQSKK92 pKa = 9.1
Molecular weight: 10.75 kDa
Isoelectric point according different methods:
Peptides (in silico digests for buttom-up proteomics)
Below you can find in silico digests of the whole proteome with Trypsin, Chymotrypsin, Trypsin+LysC, LysN, ArgC proteases suitable for different mass spec machines.| Try ESI |
 |
|---|
| ChTry ESI |
 |
|---|
| ArgC ESI |
 |
|---|
| LysN ESI |
 |
|---|
| TryLysC ESI |
 |
|---|
| Try MALDI |
 |
|---|
| ChTry MALDI |
 |
|---|
| ArgC MALDI |
 |
|---|
| LysN MALDI |
 |
|---|
| TryLysC MALDI |
 |
|---|
| Try LTQ |
 |
|---|
| ChTry LTQ |
 |
|---|
| ArgC LTQ |
 |
|---|
| LysN LTQ |
 |
|---|
| TryLysC LTQ |
 |
|---|
| Try MSlow |
 |
|---|
| ChTry MSlow |
 |
|---|
| ArgC MSlow |
 |
|---|
| LysN MSlow |
 |
|---|
| TryLysC MSlow |
 |
|---|
| Try MShigh |
 |
|---|
| ChTry MShigh |
 |
|---|
| ArgC MShigh |
 |
|---|
| LysN MShigh |
 |
|---|
| TryLysC MShigh |
 |
|---|
General Statistics
Number of major isoforms |
Number of additional isoforms |
Number of all proteins |
Number of amino acids |
Min. Seq. Length |
Max. Seq. Length |
Avg. Seq. Length |
Avg. Mol. Weight |
|---|---|---|---|---|---|---|---|
5412742 |
10 |
13998 |
441.8 |
49.73 |
Amino acid frequency
Ala |
Cys |
Asp |
Glu |
Phe |
Gly |
His |
Ile |
Lys |
Leu |
|---|---|---|---|---|---|---|---|---|---|
6.448 ± 0.021 | 2.004 ± 0.042 |
5.436 ± 0.018 | 6.706 ± 0.033 |
4.048 ± 0.017 | 5.609 ± 0.029 |
2.441 ± 0.012 | 5.736 ± 0.017 |
6.642 ± 0.031 | 9.44 ± 0.031 |
Met |
Asn |
Gln |
Pro |
Arg |
Ser |
Thr |
Val |
Trp |
Tyr |
|---|---|---|---|---|---|---|---|---|---|
2.232 ± 0.011 | 4.946 ± 0.019 |
5.065 ± 0.033 | 4.376 ± 0.019 |
5.019 ± 0.02 | 7.807 ± 0.024 |
5.478 ± 0.02 | 6.233 ± 0.018 |
1.114 ± 0.007 | 3.203 ± 0.015 |
Most of the basic statistics you can see at this page can be downloaded from this CSV file
Proteome-pI is available under Creative Commons Attribution-NoDerivs license, for more details see here
| Reference: Kozlowski LP. Proteome-pI 2.0: Proteome Isoelectric Point Database Update. Nucleic Acids Res. 2021, doi: 10.1093/nar/gkab944 | Contact: Lukasz P. Kozlowski |
