Erythranthe guttata (Yellow monkey flower) (Mimulus guttatus)
Taxonomy: cellular organisms; Eukaryota; Viridiplantae; Streptophyta; Streptophytina; Embryophyta; Tracheophyta; Euphyllophyta; Spermatophyta; Magnoliopsida; Mesangiospermae; eudicotyledons; Gunneridae; Pentapetalae; asterids; lamiids; Lamiales; Phrymaceae; Erythranthe
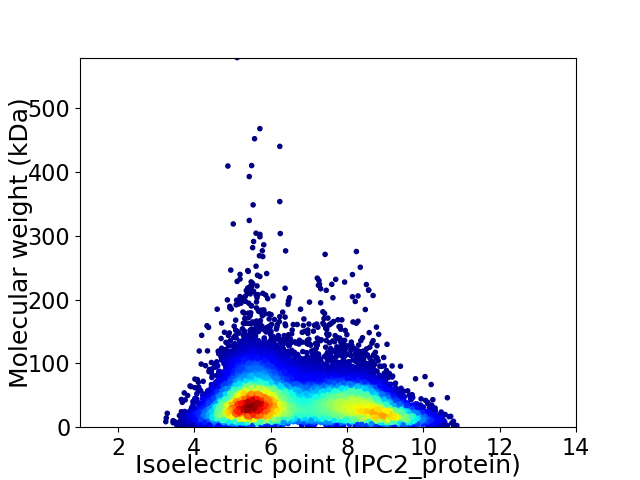
Average proteome isoelectric point is 6.72
Get precalculated fractions of proteins

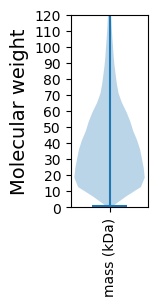
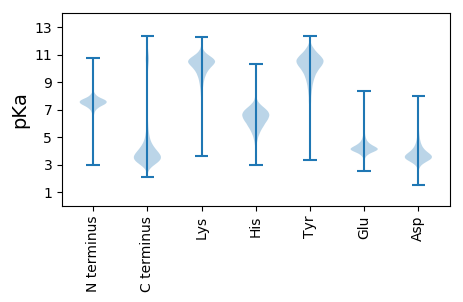
Virtual 2D-PAGE plot for 28677 proteins (isoelectric point calculated using IPC2_protein)
Get csv file with sequences according to given criteria:
* You can choose from 21 different methods for calculating isoelectric point
Summary statistics related to proteome-wise predictions


Protein with the lowest isoelectric point:
>tr|A0A022Q254|A0A022Q254_ERYGU Uncharacterized protein OS=Erythranthe guttata OX=4155 GN=MIMGU_mgv1a022953mg PE=3 SV=1
MM1 pKa = 7.57SIYY4 pKa = 10.83GPFQSPFSLLIIFFLLSLSRR24 pKa = 11.84PEE26 pKa = 4.68QMTLICDD33 pKa = 3.84ASVTPMAEE41 pKa = 4.14TQEE44 pKa = 3.8KK45 pKa = 9.86RR46 pKa = 11.84LRR48 pKa = 11.84EE49 pKa = 3.92EE50 pKa = 4.01SHH52 pKa = 7.36DD53 pKa = 4.18SEE55 pKa = 4.45TPEE58 pKa = 4.4YY59 pKa = 11.18DD60 pKa = 4.02DD61 pKa = 5.75ANSNSKK67 pKa = 9.44RR68 pKa = 11.84QKK70 pKa = 9.29PYY72 pKa = 11.41NNILSLLDD80 pKa = 3.81EE81 pKa = 4.81EE82 pKa = 5.87EE83 pKa = 4.1VDD85 pKa = 3.83QDD87 pKa = 4.35EE88 pKa = 5.56EE89 pKa = 4.4PTQDD93 pKa = 3.21LSAIFTTLEE102 pKa = 3.88QEE104 pKa = 4.12ISSTTTATAASYY116 pKa = 11.08DD117 pKa = 3.4VDD119 pKa = 4.44FPPFEE124 pKa = 4.37AAAEE128 pKa = 4.29EE129 pKa = 4.53EE130 pKa = 4.41DD131 pKa = 5.23HH132 pKa = 6.5SQQTAAACSPSSGDD146 pKa = 4.02YY147 pKa = 10.93ADD149 pKa = 4.83EE150 pKa = 5.28DD151 pKa = 4.56DD152 pKa = 4.32GVKK155 pKa = 10.41SVMRR159 pKa = 11.84HH160 pKa = 5.12LLEE163 pKa = 5.67ASDD166 pKa = 4.99DD167 pKa = 3.83EE168 pKa = 5.3LGIPTTEE175 pKa = 4.0DD176 pKa = 3.08NYY178 pKa = 11.26NSVVEE183 pKa = 4.31INYY186 pKa = 10.03SEE188 pKa = 4.16NFPFGFSDD196 pKa = 3.22HH197 pKa = 7.07GIWEE201 pKa = 4.38MEE203 pKa = 3.98DD204 pKa = 3.21VAANYY209 pKa = 8.41YY210 pKa = 10.54TMLQSEE216 pKa = 5.12LFMM219 pKa = 6.79
MM1 pKa = 7.57SIYY4 pKa = 10.83GPFQSPFSLLIIFFLLSLSRR24 pKa = 11.84PEE26 pKa = 4.68QMTLICDD33 pKa = 3.84ASVTPMAEE41 pKa = 4.14TQEE44 pKa = 3.8KK45 pKa = 9.86RR46 pKa = 11.84LRR48 pKa = 11.84EE49 pKa = 3.92EE50 pKa = 4.01SHH52 pKa = 7.36DD53 pKa = 4.18SEE55 pKa = 4.45TPEE58 pKa = 4.4YY59 pKa = 11.18DD60 pKa = 4.02DD61 pKa = 5.75ANSNSKK67 pKa = 9.44RR68 pKa = 11.84QKK70 pKa = 9.29PYY72 pKa = 11.41NNILSLLDD80 pKa = 3.81EE81 pKa = 4.81EE82 pKa = 5.87EE83 pKa = 4.1VDD85 pKa = 3.83QDD87 pKa = 4.35EE88 pKa = 5.56EE89 pKa = 4.4PTQDD93 pKa = 3.21LSAIFTTLEE102 pKa = 3.88QEE104 pKa = 4.12ISSTTTATAASYY116 pKa = 11.08DD117 pKa = 3.4VDD119 pKa = 4.44FPPFEE124 pKa = 4.37AAAEE128 pKa = 4.29EE129 pKa = 4.53EE130 pKa = 4.41DD131 pKa = 5.23HH132 pKa = 6.5SQQTAAACSPSSGDD146 pKa = 4.02YY147 pKa = 10.93ADD149 pKa = 4.83EE150 pKa = 5.28DD151 pKa = 4.56DD152 pKa = 4.32GVKK155 pKa = 10.41SVMRR159 pKa = 11.84HH160 pKa = 5.12LLEE163 pKa = 5.67ASDD166 pKa = 4.99DD167 pKa = 3.83EE168 pKa = 5.3LGIPTTEE175 pKa = 4.0DD176 pKa = 3.08NYY178 pKa = 11.26NSVVEE183 pKa = 4.31INYY186 pKa = 10.03SEE188 pKa = 4.16NFPFGFSDD196 pKa = 3.22HH197 pKa = 7.07GIWEE201 pKa = 4.38MEE203 pKa = 3.98DD204 pKa = 3.21VAANYY209 pKa = 8.41YY210 pKa = 10.54TMLQSEE216 pKa = 5.12LFMM219 pKa = 6.79
Molecular weight: 24.61 kDa
Isoelectric point according different methods:
Protein with the highest isoelectric point:
>tr|A0A022RKR6|A0A022RKR6_ERYGU Uncharacterized protein OS=Erythranthe guttata OX=4155 GN=MIMGU_mgv1a023577mg PE=4 SV=1
SS1 pKa = 6.44SRR3 pKa = 11.84TRR5 pKa = 11.84MRR7 pKa = 11.84IKK9 pKa = 10.41KK10 pKa = 9.38RR11 pKa = 11.84AQKK14 pKa = 10.55HH15 pKa = 4.38SLQKK19 pKa = 10.27IRR21 pKa = 11.84TT22 pKa = 3.88
SS1 pKa = 6.44SRR3 pKa = 11.84TRR5 pKa = 11.84MRR7 pKa = 11.84IKK9 pKa = 10.41KK10 pKa = 9.38RR11 pKa = 11.84AQKK14 pKa = 10.55HH15 pKa = 4.38SLQKK19 pKa = 10.27IRR21 pKa = 11.84TT22 pKa = 3.88
Molecular weight: 2.71 kDa
Isoelectric point according different methods:
Peptides (in silico digests for buttom-up proteomics)
Below you can find in silico digests of the whole proteome with Trypsin, Chymotrypsin, Trypsin+LysC, LysN, ArgC proteases suitable for different mass spec machines.| Try ESI |
 |
|---|
| ChTry ESI |
 |
|---|
| ArgC ESI |
 |
|---|
| LysN ESI |
 |
|---|
| TryLysC ESI |
 |
|---|
| Try MALDI |
 |
|---|
| ChTry MALDI |
 |
|---|
| ArgC MALDI |
 |
|---|
| LysN MALDI |
 |
|---|
| TryLysC MALDI |
 |
|---|
| Try LTQ |
 |
|---|
| ChTry LTQ |
 |
|---|
| ArgC LTQ |
 |
|---|
| LysN LTQ |
 |
|---|
| TryLysC LTQ |
 |
|---|
| Try MSlow |
 |
|---|
| ChTry MSlow |
 |
|---|
| ArgC MSlow |
 |
|---|
| LysN MSlow |
 |
|---|
| TryLysC MSlow |
 |
|---|
| Try MShigh |
 |
|---|
| ChTry MShigh |
 |
|---|
| ArgC MShigh |
 |
|---|
| LysN MShigh |
 |
|---|
| TryLysC MShigh |
 |
|---|
General Statistics
Number of major isoforms |
Number of additional isoforms |
Number of all proteins |
Number of amino acids |
Min. Seq. Length |
Max. Seq. Length |
Avg. Seq. Length |
Avg. Mol. Weight |
|---|---|---|---|---|---|---|---|
10799916 |
8 |
5112 |
376.6 |
42.05 |
Amino acid frequency
Ala |
Cys |
Asp |
Glu |
Phe |
Gly |
His |
Ile |
Lys |
Leu |
|---|---|---|---|---|---|---|---|---|---|
6.75 ± 0.013 | 1.849 ± 0.007 |
5.355 ± 0.01 | 6.425 ± 0.014 |
4.346 ± 0.01 | 6.56 ± 0.011 |
2.313 ± 0.006 | 5.568 ± 0.011 |
6.104 ± 0.013 | 9.554 ± 0.016 |
Met |
Asn |
Gln |
Pro |
Arg |
Ser |
Thr |
Val |
Trp |
Tyr |
|---|---|---|---|---|---|---|---|---|---|
2.356 ± 0.007 | 4.694 ± 0.009 |
4.847 ± 0.015 | 3.375 ± 0.01 |
5.319 ± 0.011 | 8.784 ± 0.015 |
4.939 ± 0.008 | 6.653 ± 0.009 |
1.279 ± 0.005 | 2.931 ± 0.008 |
Most of the basic statistics you can see at this page can be downloaded from this CSV file
Proteome-pI is available under Creative Commons Attribution-NoDerivs license, for more details see here
| Reference: Kozlowski LP. Proteome-pI 2.0: Proteome Isoelectric Point Database Update. Nucleic Acids Res. 2021, doi: 10.1093/nar/gkab944 | Contact: Lukasz P. Kozlowski |
