Clematis chlorotic mottle virus
Taxonomy: Viruses; Riboviria; Orthornavirae; Kitrinoviricota; Tolucaviricetes; Tolivirales; Tombusviridae; Procedovirinae; Pelarspovirus
Average proteome isoelectric point is 7.81
Get precalculated fractions of proteins

Virtual 2D-PAGE plot for 5 proteins (isoelectric point calculated using IPC2_protein)
Get csv file with sequences according to given criteria:
* You can choose from 21 different methods for calculating isoelectric point
Summary statistics related to proteome-wise predictions


Protein with the lowest isoelectric point:
>tr|A0A1Q1MKB5|A0A1Q1MKB5_9TOMB MP-1 OS=Clematis chlorotic mottle virus OX=1950126 GN=p7 PE=4 SV=1
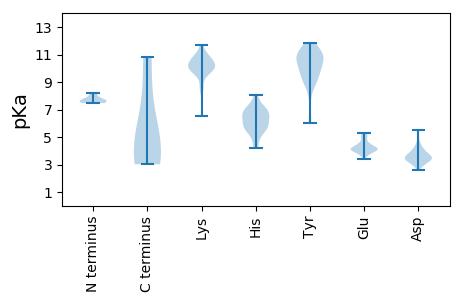
MM1 pKa = 7.64ASFVSSFLNGLSVLVNVEE19 pKa = 3.99CVLAHH24 pKa = 6.2TLYY27 pKa = 10.39EE28 pKa = 4.29LCTEE32 pKa = 5.04VITQQPSDD40 pKa = 4.14TISAICAAAGSIPADD55 pKa = 3.52PVEE58 pKa = 4.11EE59 pKa = 4.23ALLFTATDD67 pKa = 3.38IQTSLVLEE75 pKa = 5.26DD76 pKa = 5.52DD77 pKa = 4.5LDD79 pKa = 3.51HH80 pKa = 7.23HH81 pKa = 6.94IIKK84 pKa = 10.74EE85 pKa = 4.1EE86 pKa = 3.74VDD88 pKa = 3.17EE89 pKa = 4.83GKK91 pKa = 11.01GEE93 pKa = 4.13EE94 pKa = 4.27VKK96 pKa = 10.65KK97 pKa = 10.16KK98 pKa = 9.93HH99 pKa = 5.54VRR101 pKa = 11.84SRR103 pKa = 11.84VNNRR107 pKa = 11.84VPFAVILAQAAKK119 pKa = 9.97AHH121 pKa = 6.36FGGIPTASRR130 pKa = 11.84ANEE133 pKa = 3.98LSVMKK138 pKa = 10.34YY139 pKa = 9.92LASKK143 pKa = 10.85CEE145 pKa = 4.02EE146 pKa = 4.04LKK148 pKa = 9.61VTPTHH153 pKa = 5.69TRR155 pKa = 11.84ACVTRR160 pKa = 11.84AFPLVFTPDD169 pKa = 3.38EE170 pKa = 4.99DD171 pKa = 3.84DD172 pKa = 3.68LRR174 pKa = 11.84VYY176 pKa = 11.22RR177 pKa = 11.84MLNSEE182 pKa = 4.23NARR185 pKa = 11.84SRR187 pKa = 11.84RR188 pKa = 11.84DD189 pKa = 3.17QYY191 pKa = 11.85LEE193 pKa = 3.68ARR195 pKa = 11.84KK196 pKa = 9.7IPSWWMQLLDD206 pKa = 3.88NPLCARR212 pKa = 11.84AWVRR216 pKa = 11.84MYY218 pKa = 10.93RR219 pKa = 11.84RR220 pKa = 11.84FCGMPDD226 pKa = 2.87EE227 pKa = 5.28KK228 pKa = 11.17AFQFVKK234 pKa = 10.85
MM1 pKa = 7.64ASFVSSFLNGLSVLVNVEE19 pKa = 3.99CVLAHH24 pKa = 6.2TLYY27 pKa = 10.39EE28 pKa = 4.29LCTEE32 pKa = 5.04VITQQPSDD40 pKa = 4.14TISAICAAAGSIPADD55 pKa = 3.52PVEE58 pKa = 4.11EE59 pKa = 4.23ALLFTATDD67 pKa = 3.38IQTSLVLEE75 pKa = 5.26DD76 pKa = 5.52DD77 pKa = 4.5LDD79 pKa = 3.51HH80 pKa = 7.23HH81 pKa = 6.94IIKK84 pKa = 10.74EE85 pKa = 4.1EE86 pKa = 3.74VDD88 pKa = 3.17EE89 pKa = 4.83GKK91 pKa = 11.01GEE93 pKa = 4.13EE94 pKa = 4.27VKK96 pKa = 10.65KK97 pKa = 10.16KK98 pKa = 9.93HH99 pKa = 5.54VRR101 pKa = 11.84SRR103 pKa = 11.84VNNRR107 pKa = 11.84VPFAVILAQAAKK119 pKa = 9.97AHH121 pKa = 6.36FGGIPTASRR130 pKa = 11.84ANEE133 pKa = 3.98LSVMKK138 pKa = 10.34YY139 pKa = 9.92LASKK143 pKa = 10.85CEE145 pKa = 4.02EE146 pKa = 4.04LKK148 pKa = 9.61VTPTHH153 pKa = 5.69TRR155 pKa = 11.84ACVTRR160 pKa = 11.84AFPLVFTPDD169 pKa = 3.38EE170 pKa = 4.99DD171 pKa = 3.84DD172 pKa = 3.68LRR174 pKa = 11.84VYY176 pKa = 11.22RR177 pKa = 11.84MLNSEE182 pKa = 4.23NARR185 pKa = 11.84SRR187 pKa = 11.84RR188 pKa = 11.84DD189 pKa = 3.17QYY191 pKa = 11.85LEE193 pKa = 3.68ARR195 pKa = 11.84KK196 pKa = 9.7IPSWWMQLLDD206 pKa = 3.88NPLCARR212 pKa = 11.84AWVRR216 pKa = 11.84MYY218 pKa = 10.93RR219 pKa = 11.84RR220 pKa = 11.84FCGMPDD226 pKa = 2.87EE227 pKa = 5.28KK228 pKa = 11.17AFQFVKK234 pKa = 10.85
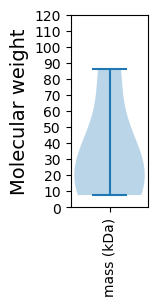
Molecular weight: 26.36 kDa
Isoelectric point according different methods:
Protein with the highest isoelectric point:
>tr|A0A1Q1MKB7|A0A1Q1MKB7_9TOMB Capsid protein OS=Clematis chlorotic mottle virus OX=1950126 GN=p37 PE=3 SV=1
MM1 pKa = 8.22DD2 pKa = 5.0FGEE5 pKa = 4.69SNTTEE10 pKa = 3.93LDD12 pKa = 3.26KK13 pKa = 11.33TKK15 pKa = 10.8TNVGVEE21 pKa = 4.51KK22 pKa = 10.41KK23 pKa = 9.98RR24 pKa = 11.84KK25 pKa = 9.51RR26 pKa = 11.84GSAKK30 pKa = 10.23NKK32 pKa = 10.09LDD34 pKa = 3.43VAHH37 pKa = 6.72NSVGKK42 pKa = 9.75SQSHH46 pKa = 6.92DD47 pKa = 3.34LVGANFITIADD58 pKa = 3.79KK59 pKa = 11.53VKK61 pKa = 9.7FTVHH65 pKa = 5.65LHH67 pKa = 5.42FF68 pKa = 5.76
MM1 pKa = 8.22DD2 pKa = 5.0FGEE5 pKa = 4.69SNTTEE10 pKa = 3.93LDD12 pKa = 3.26KK13 pKa = 11.33TKK15 pKa = 10.8TNVGVEE21 pKa = 4.51KK22 pKa = 10.41KK23 pKa = 9.98RR24 pKa = 11.84KK25 pKa = 9.51RR26 pKa = 11.84GSAKK30 pKa = 10.23NKK32 pKa = 10.09LDD34 pKa = 3.43VAHH37 pKa = 6.72NSVGKK42 pKa = 9.75SQSHH46 pKa = 6.92DD47 pKa = 3.34LVGANFITIADD58 pKa = 3.79KK59 pKa = 11.53VKK61 pKa = 9.7FTVHH65 pKa = 5.65LHH67 pKa = 5.42FF68 pKa = 5.76
Molecular weight: 7.53 kDa
Isoelectric point according different methods:
Peptides (in silico digests for buttom-up proteomics)
Below you can find in silico digests of the whole proteome with Trypsin, Chymotrypsin, Trypsin+LysC, LysN, ArgC proteases suitable for different mass spec machines.| Try ESI |
 |
|---|
| ChTry ESI |
 |
|---|
| ArgC ESI |
 |
|---|
| LysN ESI |
 |
|---|
| TryLysC ESI |
 |
|---|
| Try MALDI |
 |
|---|
| ChTry MALDI |
 |
|---|
| ArgC MALDI |
 |
|---|
| LysN MALDI |
 |
|---|
| TryLysC MALDI |
 |
|---|
| Try LTQ |
 |
|---|
| ChTry LTQ |
 |
|---|
| ArgC LTQ |
 |
|---|
| LysN LTQ |
 |
|---|
| TryLysC LTQ |
 |
|---|
| Try MSlow |
 |
|---|
| ChTry MSlow |
 |
|---|
| ArgC MSlow |
 |
|---|
| LysN MSlow |
 |
|---|
| TryLysC MSlow |
 |
|---|
| Try MShigh |
 |
|---|
| ChTry MShigh |
 |
|---|
| ArgC MShigh |
 |
|---|
| LysN MShigh |
 |
|---|
| TryLysC MShigh |
 |
|---|
General Statistics
Number of major isoforms |
Number of additional isoforms |
Number of all proteins |
Number of amino acids |
Min. Seq. Length |
Max. Seq. Length |
Avg. Seq. Length |
Avg. Mol. Weight |
|---|---|---|---|---|---|---|---|
0 |
1480 |
68 |
756 |
296.0 |
33.25 |
Amino acid frequency
Ala |
Cys |
Asp |
Glu |
Phe |
Gly |
His |
Ile |
Lys |
Leu |
|---|---|---|---|---|---|---|---|---|---|
7.027 ± 0.81 | 2.568 ± 0.413 |
5.27 ± 0.333 | 5.473 ± 1.025 |
4.595 ± 0.217 | 6.081 ± 0.784 |
2.905 ± 0.413 | 4.595 ± 0.543 |
5.946 ± 0.821 | 9.122 ± 0.429 |
Met |
Asn |
Gln |
Pro |
Arg |
Ser |
Thr |
Val |
Trp |
Tyr |
|---|---|---|---|---|---|---|---|---|---|
2.77 ± 0.277 | 3.919 ± 0.47 |
4.797 ± 0.512 | 3.446 ± 0.26 |
6.486 ± 0.76 | 7.5 ± 1.506 |
5.946 ± 0.861 | 7.432 ± 0.588 |
1.284 ± 0.264 | 2.77 ± 0.366 |
Most of the basic statistics you can see at this page can be downloaded from this CSV file
Proteome-pI is available under Creative Commons Attribution-NoDerivs license, for more details see here
| Reference: Kozlowski LP. Proteome-pI 2.0: Proteome Isoelectric Point Database Update. Nucleic Acids Res. 2021, doi: 10.1093/nar/gkab944 | Contact: Lukasz P. Kozlowski |
