Actinotalea ferrariae CF5-4
Taxonomy: cellular organisms; Bacteria; Terrabacteria group; Actinobacteria; Actinomycetia; Micrococcales; Cellulomonadaceae; Actinotalea; Actinotalea ferrariae
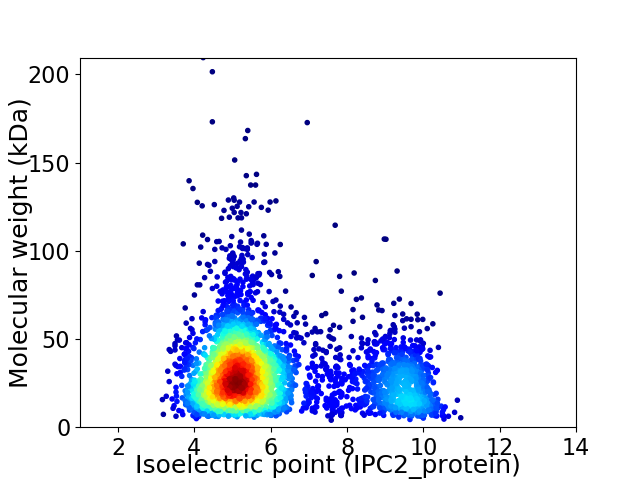
Average proteome isoelectric point is 6.15
Get precalculated fractions of proteins

Virtual 2D-PAGE plot for 3558 proteins (isoelectric point calculated using IPC2_protein)
Get csv file with sequences according to given criteria:
* You can choose from 21 different methods for calculating isoelectric point
Summary statistics related to proteome-wise predictions


Protein with the lowest isoelectric point:
>tr|A0A021VSH3|A0A021VSH3_9CELL Permease (Fragment) OS=Actinotalea ferrariae CF5-4 OX=948458 GN=N866_15590 PE=4 SV=1
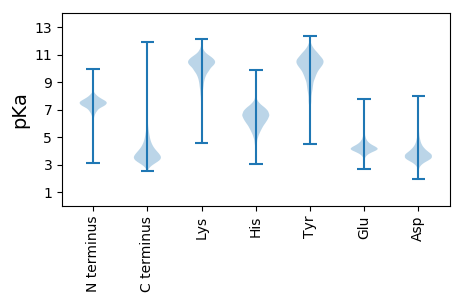
MM1 pKa = 6.84VAALALTACAPASSEE16 pKa = 5.13DD17 pKa = 3.67PTEE20 pKa = 4.49PPAEE24 pKa = 4.07TAGASDD30 pKa = 5.55DD31 pKa = 4.02EE32 pKa = 4.91TGDD35 pKa = 3.57EE36 pKa = 4.86APAQAEE42 pKa = 4.41GTLKK46 pKa = 10.57VGYY49 pKa = 9.77ISPITGNFAVAGQEE63 pKa = 4.74MVDD66 pKa = 3.15GWNLYY71 pKa = 9.1WEE73 pKa = 4.49INGNEE78 pKa = 4.12VNGVTVEE85 pKa = 4.41TIVEE89 pKa = 4.09DD90 pKa = 3.97DD91 pKa = 3.94AGNPEE96 pKa = 3.78ISLTKK101 pKa = 10.09ARR103 pKa = 11.84KK104 pKa = 8.97LVEE107 pKa = 4.1SDD109 pKa = 3.3QVDD112 pKa = 4.19VVVGPLLANTALAVAEE128 pKa = 4.31YY129 pKa = 8.79TSSVGVPNLHH139 pKa = 6.58PVAAADD145 pKa = 5.2DD146 pKa = 4.06LTQRR150 pKa = 11.84AANDD154 pKa = 3.25FTVRR158 pKa = 11.84SGSMSGSQANYY169 pKa = 9.66PGGVWAADD177 pKa = 3.57QGHH180 pKa = 5.51EE181 pKa = 4.31TAVTLCPDD189 pKa = 3.51YY190 pKa = 11.55AFGWEE195 pKa = 4.02SCAGFKK201 pKa = 10.36QGFEE205 pKa = 4.15QNGGEE210 pKa = 4.17VTAQFWYY217 pKa = 9.94PNGTSDD223 pKa = 3.77FSTYY227 pKa = 9.87VSQLQSAGADD237 pKa = 2.89IAYY240 pKa = 9.94VATAGGAPGPDD251 pKa = 3.61FMRR254 pKa = 11.84SFLGLGLKK262 pKa = 8.57DD263 pKa = 3.78TQPLLMNCCSMDD275 pKa = 3.51QATLRR280 pKa = 11.84AMGTEE285 pKa = 3.86VLGIHH290 pKa = 6.31SVSNWAEE297 pKa = 3.73GRR299 pKa = 11.84DD300 pKa = 3.79APEE303 pKa = 3.65VAEE306 pKa = 4.85FNAAYY311 pKa = 10.37AEE313 pKa = 4.36RR314 pKa = 11.84YY315 pKa = 9.06DD316 pKa = 4.46GKK318 pKa = 10.68IPSLNVAGGYY328 pKa = 7.45VTASQVAQVLAEE340 pKa = 4.19NGLVTGDD347 pKa = 3.91EE348 pKa = 4.15LVAAISATTFEE359 pKa = 4.93DD360 pKa = 3.82SILGKK365 pKa = 8.28TVFDD369 pKa = 4.51EE370 pKa = 4.51YY371 pKa = 11.26NNPVSPVYY379 pKa = 10.05IRR381 pKa = 11.84EE382 pKa = 4.05VQEE385 pKa = 4.37VDD387 pKa = 3.33GQLLNVPIEE396 pKa = 4.19TFDD399 pKa = 6.05AVDD402 pKa = 3.02QWLGMDD408 pKa = 4.4PEE410 pKa = 4.27EE411 pKa = 5.55AMARR415 pKa = 11.84PNYY418 pKa = 9.48SQQFQGG424 pKa = 3.76
MM1 pKa = 6.84VAALALTACAPASSEE16 pKa = 5.13DD17 pKa = 3.67PTEE20 pKa = 4.49PPAEE24 pKa = 4.07TAGASDD30 pKa = 5.55DD31 pKa = 4.02EE32 pKa = 4.91TGDD35 pKa = 3.57EE36 pKa = 4.86APAQAEE42 pKa = 4.41GTLKK46 pKa = 10.57VGYY49 pKa = 9.77ISPITGNFAVAGQEE63 pKa = 4.74MVDD66 pKa = 3.15GWNLYY71 pKa = 9.1WEE73 pKa = 4.49INGNEE78 pKa = 4.12VNGVTVEE85 pKa = 4.41TIVEE89 pKa = 4.09DD90 pKa = 3.97DD91 pKa = 3.94AGNPEE96 pKa = 3.78ISLTKK101 pKa = 10.09ARR103 pKa = 11.84KK104 pKa = 8.97LVEE107 pKa = 4.1SDD109 pKa = 3.3QVDD112 pKa = 4.19VVVGPLLANTALAVAEE128 pKa = 4.31YY129 pKa = 8.79TSSVGVPNLHH139 pKa = 6.58PVAAADD145 pKa = 5.2DD146 pKa = 4.06LTQRR150 pKa = 11.84AANDD154 pKa = 3.25FTVRR158 pKa = 11.84SGSMSGSQANYY169 pKa = 9.66PGGVWAADD177 pKa = 3.57QGHH180 pKa = 5.51EE181 pKa = 4.31TAVTLCPDD189 pKa = 3.51YY190 pKa = 11.55AFGWEE195 pKa = 4.02SCAGFKK201 pKa = 10.36QGFEE205 pKa = 4.15QNGGEE210 pKa = 4.17VTAQFWYY217 pKa = 9.94PNGTSDD223 pKa = 3.77FSTYY227 pKa = 9.87VSQLQSAGADD237 pKa = 2.89IAYY240 pKa = 9.94VATAGGAPGPDD251 pKa = 3.61FMRR254 pKa = 11.84SFLGLGLKK262 pKa = 8.57DD263 pKa = 3.78TQPLLMNCCSMDD275 pKa = 3.51QATLRR280 pKa = 11.84AMGTEE285 pKa = 3.86VLGIHH290 pKa = 6.31SVSNWAEE297 pKa = 3.73GRR299 pKa = 11.84DD300 pKa = 3.79APEE303 pKa = 3.65VAEE306 pKa = 4.85FNAAYY311 pKa = 10.37AEE313 pKa = 4.36RR314 pKa = 11.84YY315 pKa = 9.06DD316 pKa = 4.46GKK318 pKa = 10.68IPSLNVAGGYY328 pKa = 7.45VTASQVAQVLAEE340 pKa = 4.19NGLVTGDD347 pKa = 3.91EE348 pKa = 4.15LVAAISATTFEE359 pKa = 4.93DD360 pKa = 3.82SILGKK365 pKa = 8.28TVFDD369 pKa = 4.51EE370 pKa = 4.51YY371 pKa = 11.26NNPVSPVYY379 pKa = 10.05IRR381 pKa = 11.84EE382 pKa = 4.05VQEE385 pKa = 4.37VDD387 pKa = 3.33GQLLNVPIEE396 pKa = 4.19TFDD399 pKa = 6.05AVDD402 pKa = 3.02QWLGMDD408 pKa = 4.4PEE410 pKa = 4.27EE411 pKa = 5.55AMARR415 pKa = 11.84PNYY418 pKa = 9.48SQQFQGG424 pKa = 3.76
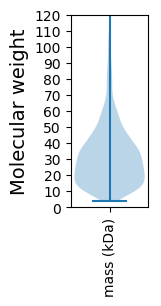
Molecular weight: 44.65 kDa
Isoelectric point according different methods:
Protein with the highest isoelectric point:
>tr|A0A021VQV5|A0A021VQV5_9CELL UPF0301 protein N866_19500 OS=Actinotalea ferrariae CF5-4 OX=948458 GN=N866_19500 PE=3 SV=1
MM1 pKa = 7.69SKK3 pKa = 9.0RR4 pKa = 11.84TFQPNNRR11 pKa = 11.84RR12 pKa = 11.84RR13 pKa = 11.84AKK15 pKa = 8.7THH17 pKa = 5.15GFRR20 pKa = 11.84LRR22 pKa = 11.84MRR24 pKa = 11.84TRR26 pKa = 11.84AGRR29 pKa = 11.84AILAARR35 pKa = 11.84RR36 pKa = 11.84RR37 pKa = 11.84KK38 pKa = 9.97GRR40 pKa = 11.84TEE42 pKa = 3.99LSAA45 pKa = 4.86
MM1 pKa = 7.69SKK3 pKa = 9.0RR4 pKa = 11.84TFQPNNRR11 pKa = 11.84RR12 pKa = 11.84RR13 pKa = 11.84AKK15 pKa = 8.7THH17 pKa = 5.15GFRR20 pKa = 11.84LRR22 pKa = 11.84MRR24 pKa = 11.84TRR26 pKa = 11.84AGRR29 pKa = 11.84AILAARR35 pKa = 11.84RR36 pKa = 11.84RR37 pKa = 11.84KK38 pKa = 9.97GRR40 pKa = 11.84TEE42 pKa = 3.99LSAA45 pKa = 4.86
Molecular weight: 5.34 kDa
Isoelectric point according different methods:
Peptides (in silico digests for buttom-up proteomics)
Below you can find in silico digests of the whole proteome with Trypsin, Chymotrypsin, Trypsin+LysC, LysN, ArgC proteases suitable for different mass spec machines.| Try ESI |
 |
|---|
| ChTry ESI |
 |
|---|
| ArgC ESI |
 |
|---|
| LysN ESI |
 |
|---|
| TryLysC ESI |
 |
|---|
| Try MALDI |
 |
|---|
| ChTry MALDI |
 |
|---|
| ArgC MALDI |
 |
|---|
| LysN MALDI |
 |
|---|
| TryLysC MALDI |
 |
|---|
| Try LTQ |
 |
|---|
| ChTry LTQ |
 |
|---|
| ArgC LTQ |
 |
|---|
| LysN LTQ |
 |
|---|
| TryLysC LTQ |
 |
|---|
| Try MSlow |
 |
|---|
| ChTry MSlow |
 |
|---|
| ArgC MSlow |
 |
|---|
| LysN MSlow |
 |
|---|
| TryLysC MSlow |
 |
|---|
| Try MShigh |
 |
|---|
| ChTry MShigh |
 |
|---|
| ArgC MShigh |
 |
|---|
| LysN MShigh |
 |
|---|
| TryLysC MShigh |
 |
|---|
General Statistics
Number of major isoforms |
Number of additional isoforms |
Number of all proteins |
Number of amino acids |
Min. Seq. Length |
Max. Seq. Length |
Avg. Seq. Length |
Avg. Mol. Weight |
|---|---|---|---|---|---|---|---|
0 |
1116291 |
35 |
1964 |
313.7 |
33.35 |
Amino acid frequency
Ala |
Cys |
Asp |
Glu |
Phe |
Gly |
His |
Ile |
Lys |
Leu |
|---|---|---|---|---|---|---|---|---|---|
14.285 ± 0.062 | 0.591 ± 0.011 |
6.395 ± 0.035 | 5.634 ± 0.036 |
2.466 ± 0.027 | 9.427 ± 0.036 |
2.245 ± 0.022 | 2.692 ± 0.027 |
1.29 ± 0.027 | 10.503 ± 0.042 |
Met |
Asn |
Gln |
Pro |
Arg |
Ser |
Thr |
Val |
Trp |
Tyr |
|---|---|---|---|---|---|---|---|---|---|
1.614 ± 0.016 | 1.389 ± 0.018 |
6.076 ± 0.035 | 2.659 ± 0.019 |
8.269 ± 0.043 | 4.588 ± 0.022 |
6.27 ± 0.033 | 10.377 ± 0.045 |
1.497 ± 0.017 | 1.73 ± 0.021 |
Most of the basic statistics you can see at this page can be downloaded from this CSV file
Proteome-pI is available under Creative Commons Attribution-NoDerivs license, for more details see here
| Reference: Kozlowski LP. Proteome-pI 2.0: Proteome Isoelectric Point Database Update. Nucleic Acids Res. 2021, doi: 10.1093/nar/gkab944 | Contact: Lukasz P. Kozlowski |
