Fusarium oxysporum NRRL 32931
Taxonomy: cellular organisms; Eukaryota; Opisthokonta; Fungi; Dikarya; Ascomycota; saccharomyceta; Pezizomycotina; leotiomyceta; sordariomyceta; Sordariomycetes; Hypocreomycetidae; Hypocreales; Nectriaceae; Fusarium; Fusarium oxysporum species complex; Fusarium oxysporum
Average proteome isoelectric point is 6.44
Get precalculated fractions of proteins

Virtual 2D-PAGE plot for 20767 proteins (isoelectric point calculated using IPC2_protein)
Get csv file with sequences according to given criteria:
* You can choose from 21 different methods for calculating isoelectric point
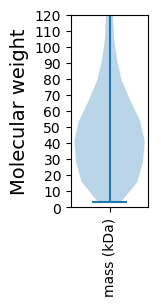
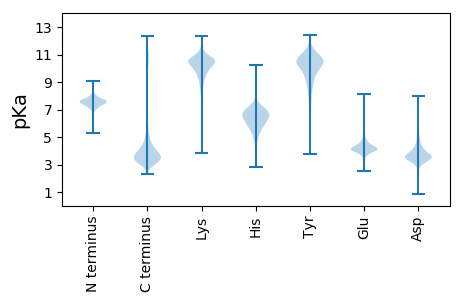
Summary statistics related to proteome-wise predictions


Protein with the lowest isoelectric point:
>tr|W9HMB3|W9HMB3_FUSOX Uncharacterized protein OS=Fusarium oxysporum NRRL 32931 OX=660029 GN=FOYG_14246 PE=4 SV=1
MM1 pKa = 7.6RR2 pKa = 11.84FSVLFAFGLVTNVANASVCKK22 pKa = 9.81PRR24 pKa = 11.84PSDD27 pKa = 3.44SSSASSVEE35 pKa = 4.17SVTLSISATAPTTTVAAEE53 pKa = 4.18TTTATSADD61 pKa = 3.78LSSTFASTVGNEE73 pKa = 4.06TTTEE77 pKa = 4.44AIEE80 pKa = 4.24TATTTDD86 pKa = 3.89TITTAATTTAEE97 pKa = 4.27TTTADD102 pKa = 3.44ATTTSADD109 pKa = 3.44TFVPIPTFDD118 pKa = 3.3VLAIGAQVDD127 pKa = 4.16GQKK130 pKa = 10.67LRR132 pKa = 11.84GHH134 pKa = 5.52VTTDD138 pKa = 3.3YY139 pKa = 11.72GMGWNLDD146 pKa = 3.54RR147 pKa = 11.84TPPILAFSIDD157 pKa = 3.69PDD159 pKa = 4.04TNQVKK164 pKa = 9.49EE165 pKa = 4.01VNGNYY170 pKa = 10.39LCLQYY175 pKa = 11.33GDD177 pKa = 4.72PNEE180 pKa = 5.15DD181 pKa = 3.32YY182 pKa = 11.3PNFLKK187 pKa = 10.96LCDD190 pKa = 4.45PGSVTNIDD198 pKa = 3.32IGLGMVTCEE207 pKa = 3.75QTRR210 pKa = 11.84DD211 pKa = 3.32RR212 pKa = 11.84RR213 pKa = 11.84LEE215 pKa = 4.12CSTPAAQCVEE225 pKa = 4.31DD226 pKa = 4.9DD227 pKa = 3.65MTRR230 pKa = 11.84MVTCSEE236 pKa = 4.19LPGTFTGFYY245 pKa = 8.88TYY247 pKa = 11.04SGMSEE252 pKa = 4.75GITLVMGPEE261 pKa = 4.5SNGPTGTAYY270 pKa = 10.53QSVDD274 pKa = 3.62LGIEE278 pKa = 3.99PASQQ282 pKa = 2.85
MM1 pKa = 7.6RR2 pKa = 11.84FSVLFAFGLVTNVANASVCKK22 pKa = 9.81PRR24 pKa = 11.84PSDD27 pKa = 3.44SSSASSVEE35 pKa = 4.17SVTLSISATAPTTTVAAEE53 pKa = 4.18TTTATSADD61 pKa = 3.78LSSTFASTVGNEE73 pKa = 4.06TTTEE77 pKa = 4.44AIEE80 pKa = 4.24TATTTDD86 pKa = 3.89TITTAATTTAEE97 pKa = 4.27TTTADD102 pKa = 3.44ATTTSADD109 pKa = 3.44TFVPIPTFDD118 pKa = 3.3VLAIGAQVDD127 pKa = 4.16GQKK130 pKa = 10.67LRR132 pKa = 11.84GHH134 pKa = 5.52VTTDD138 pKa = 3.3YY139 pKa = 11.72GMGWNLDD146 pKa = 3.54RR147 pKa = 11.84TPPILAFSIDD157 pKa = 3.69PDD159 pKa = 4.04TNQVKK164 pKa = 9.49EE165 pKa = 4.01VNGNYY170 pKa = 10.39LCLQYY175 pKa = 11.33GDD177 pKa = 4.72PNEE180 pKa = 5.15DD181 pKa = 3.32YY182 pKa = 11.3PNFLKK187 pKa = 10.96LCDD190 pKa = 4.45PGSVTNIDD198 pKa = 3.32IGLGMVTCEE207 pKa = 3.75QTRR210 pKa = 11.84DD211 pKa = 3.32RR212 pKa = 11.84RR213 pKa = 11.84LEE215 pKa = 4.12CSTPAAQCVEE225 pKa = 4.31DD226 pKa = 4.9DD227 pKa = 3.65MTRR230 pKa = 11.84MVTCSEE236 pKa = 4.19LPGTFTGFYY245 pKa = 8.88TYY247 pKa = 11.04SGMSEE252 pKa = 4.75GITLVMGPEE261 pKa = 4.5SNGPTGTAYY270 pKa = 10.53QSVDD274 pKa = 3.62LGIEE278 pKa = 3.99PASQQ282 pKa = 2.85
Molecular weight: 29.59 kDa
Isoelectric point according different methods:
Protein with the highest isoelectric point:
>tr|W9IYV0|W9IYV0_FUSOX Uncharacterized protein OS=Fusarium oxysporum NRRL 32931 OX=660029 GN=FOYG_02598 PE=4 SV=1
MM1 pKa = 6.94TGGMIVRR8 pKa = 11.84RR9 pKa = 11.84RR10 pKa = 11.84RR11 pKa = 11.84QATTGWGIGSQSAKK25 pKa = 7.28TQPRR29 pKa = 11.84RR30 pKa = 11.84SRR32 pKa = 11.84GPAGMSS38 pKa = 3.07
MM1 pKa = 6.94TGGMIVRR8 pKa = 11.84RR9 pKa = 11.84RR10 pKa = 11.84RR11 pKa = 11.84QATTGWGIGSQSAKK25 pKa = 7.28TQPRR29 pKa = 11.84RR30 pKa = 11.84SRR32 pKa = 11.84GPAGMSS38 pKa = 3.07
Molecular weight: 4.09 kDa
Isoelectric point according different methods:
Peptides (in silico digests for buttom-up proteomics)
Below you can find in silico digests of the whole proteome with Trypsin, Chymotrypsin, Trypsin+LysC, LysN, ArgC proteases suitable for different mass spec machines.| Try ESI |
 |
|---|
| ChTry ESI |
 |
|---|
| ArgC ESI |
 |
|---|
| LysN ESI |
 |
|---|
| TryLysC ESI |
 |
|---|
| Try MALDI |
 |
|---|
| ChTry MALDI |
 |
|---|
| ArgC MALDI |
 |
|---|
| LysN MALDI |
 |
|---|
| TryLysC MALDI |
 |
|---|
| Try LTQ |
 |
|---|
| ChTry LTQ |
 |
|---|
| ArgC LTQ |
 |
|---|
| LysN LTQ |
 |
|---|
| TryLysC LTQ |
 |
|---|
| Try MSlow |
 |
|---|
| ChTry MSlow |
 |
|---|
| ArgC MSlow |
 |
|---|
| LysN MSlow |
 |
|---|
| TryLysC MSlow |
 |
|---|
| Try MShigh |
 |
|---|
| ChTry MShigh |
 |
|---|
| ArgC MShigh |
 |
|---|
| LysN MShigh |
 |
|---|
| TryLysC MShigh |
 |
|---|
General Statistics
Number of major isoforms |
Number of additional isoforms |
Number of all proteins |
Number of amino acids |
Min. Seq. Length |
Max. Seq. Length |
Avg. Seq. Length |
Avg. Mol. Weight |
|---|---|---|---|---|---|---|---|
9582963 |
30 |
11522 |
461.5 |
51.21 |
Amino acid frequency
Ala |
Cys |
Asp |
Glu |
Phe |
Gly |
His |
Ile |
Lys |
Leu |
|---|---|---|---|---|---|---|---|---|---|
8.279 ± 0.015 | 1.332 ± 0.008 |
5.79 ± 0.012 | 6.171 ± 0.02 |
3.807 ± 0.01 | 6.72 ± 0.018 |
2.411 ± 0.008 | 5.125 ± 0.011 |
4.974 ± 0.014 | 8.856 ± 0.02 |
Met |
Asn |
Gln |
Pro |
Arg |
Ser |
Thr |
Val |
Trp |
Tyr |
|---|---|---|---|---|---|---|---|---|---|
2.277 ± 0.006 | 3.817 ± 0.01 |
5.937 ± 0.021 | 4.074 ± 0.012 |
5.893 ± 0.016 | 8.153 ± 0.019 |
6.004 ± 0.021 | 6.051 ± 0.013 |
1.522 ± 0.007 | 2.807 ± 0.008 |
Most of the basic statistics you can see at this page can be downloaded from this CSV file
Proteome-pI is available under Creative Commons Attribution-NoDerivs license, for more details see here
| Reference: Kozlowski LP. Proteome-pI 2.0: Proteome Isoelectric Point Database Update. Nucleic Acids Res. 2021, doi: 10.1093/nar/gkab944 | Contact: Lukasz P. Kozlowski |
