Bacillus phage vB_BsuM-Goe10
Taxonomy: Viruses; Duplodnaviria; Heunggongvirae; Uroviricota; Caudoviricetes; Caudovirales; Herelleviridae; Spounavirinae; Okubovirus; unclassified Okubovirus
Average proteome isoelectric point is 6.14
Get precalculated fractions of proteins

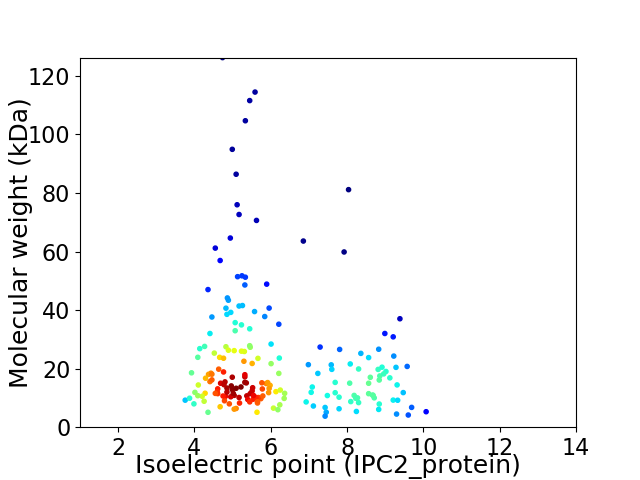
Virtual 2D-PAGE plot for 195 proteins (isoelectric point calculated using IPC2_protein)
Get csv file with sequences according to given criteria:
* You can choose from 21 different methods for calculating isoelectric point
Summary statistics related to proteome-wise predictions


Protein with the lowest isoelectric point:
>tr|A0A7G5CH91|A0A7G5CH91_9CAUD Uncharacterized protein OS=Bacillus phage vB_BsuM-Goe10 OX=2586958 GN=Goe10_c01150 PE=4 SV=1
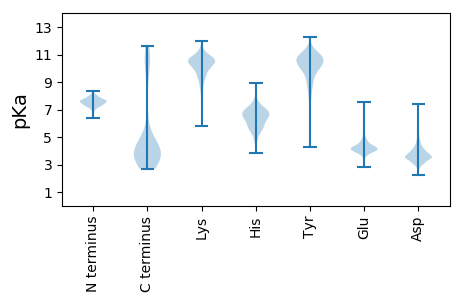
MM1 pKa = 7.83SDD3 pKa = 3.33NTDD6 pKa = 2.63KK7 pKa = 11.71SMTISVKK14 pKa = 10.21SHH16 pKa = 6.96DD17 pKa = 4.36GVTEE21 pKa = 4.69TITIPVEE28 pKa = 4.32EE29 pKa = 4.39YY30 pKa = 9.65QHH32 pKa = 6.89LIDD35 pKa = 4.63RR36 pKa = 11.84VSFLDD41 pKa = 3.62CLEE44 pKa = 4.31SAGVDD49 pKa = 2.91NWNGYY54 pKa = 9.9GEE56 pKa = 4.23AQEE59 pKa = 4.6MYY61 pKa = 10.59NGDD64 pKa = 3.98SEE66 pKa = 4.8EE67 pKa = 4.39GTDD70 pKa = 3.57GHH72 pKa = 7.0
MM1 pKa = 7.83SDD3 pKa = 3.33NTDD6 pKa = 2.63KK7 pKa = 11.71SMTISVKK14 pKa = 10.21SHH16 pKa = 6.96DD17 pKa = 4.36GVTEE21 pKa = 4.69TITIPVEE28 pKa = 4.32EE29 pKa = 4.39YY30 pKa = 9.65QHH32 pKa = 6.89LIDD35 pKa = 4.63RR36 pKa = 11.84VSFLDD41 pKa = 3.62CLEE44 pKa = 4.31SAGVDD49 pKa = 2.91NWNGYY54 pKa = 9.9GEE56 pKa = 4.23AQEE59 pKa = 4.6MYY61 pKa = 10.59NGDD64 pKa = 3.98SEE66 pKa = 4.8EE67 pKa = 4.39GTDD70 pKa = 3.57GHH72 pKa = 7.0
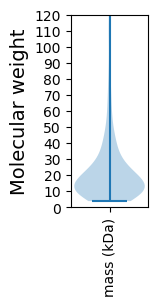
Molecular weight: 7.97 kDa
Isoelectric point according different methods:
Protein with the highest isoelectric point:
>tr|A0A7G5CH00|A0A7G5CH00_9CAUD Uncharacterized protein OS=Bacillus phage vB_BsuM-Goe10 OX=2586958 GN=Goe10_c00210 PE=4 SV=1
MM1 pKa = 7.32VKK3 pKa = 8.91YY4 pKa = 8.82TKK6 pKa = 9.77HH7 pKa = 6.52DD8 pKa = 3.66SYY10 pKa = 12.06AAIHH14 pKa = 5.75VNYY17 pKa = 9.75KK18 pKa = 9.63GRR20 pKa = 11.84KK21 pKa = 7.01IPKK24 pKa = 8.15GTYY27 pKa = 9.82DD28 pKa = 4.1CLVDD32 pKa = 5.91LDD34 pKa = 3.9ILDD37 pKa = 4.48WIISLGRR44 pKa = 11.84ALVIQINKK52 pKa = 7.97QGKK55 pKa = 8.61VYY57 pKa = 10.42FMYY60 pKa = 10.71KK61 pKa = 9.93KK62 pKa = 9.71GNKK65 pKa = 8.42MKK67 pKa = 9.56WLHH70 pKa = 5.69RR71 pKa = 11.84SIMGLKK77 pKa = 9.95EE78 pKa = 4.0GDD80 pKa = 3.62PAIVDD85 pKa = 4.12HH86 pKa = 6.92INRR89 pKa = 11.84NPSDD93 pKa = 3.45NRR95 pKa = 11.84RR96 pKa = 11.84CNLRR100 pKa = 11.84IATRR104 pKa = 11.84QINSRR109 pKa = 11.84NATNKK114 pKa = 9.33VSKK117 pKa = 10.47HH118 pKa = 4.51GYY120 pKa = 8.6KK121 pKa = 9.33WVAKK125 pKa = 10.02NRR127 pKa = 11.84NKK129 pKa = 10.03YY130 pKa = 8.53AANVRR135 pKa = 11.84HH136 pKa = 6.26NYY138 pKa = 8.64QKK140 pKa = 11.08VYY142 pKa = 10.21LGNYY146 pKa = 7.18DD147 pKa = 3.7TPLEE151 pKa = 4.04AHH153 pKa = 6.43RR154 pKa = 11.84VANRR158 pKa = 11.84WVHH161 pKa = 5.49EE162 pKa = 4.42NIGSEE167 pKa = 4.16FCVRR171 pKa = 11.84EE172 pKa = 4.31PIRR175 pKa = 11.84LNN177 pKa = 3.34
MM1 pKa = 7.32VKK3 pKa = 8.91YY4 pKa = 8.82TKK6 pKa = 9.77HH7 pKa = 6.52DD8 pKa = 3.66SYY10 pKa = 12.06AAIHH14 pKa = 5.75VNYY17 pKa = 9.75KK18 pKa = 9.63GRR20 pKa = 11.84KK21 pKa = 7.01IPKK24 pKa = 8.15GTYY27 pKa = 9.82DD28 pKa = 4.1CLVDD32 pKa = 5.91LDD34 pKa = 3.9ILDD37 pKa = 4.48WIISLGRR44 pKa = 11.84ALVIQINKK52 pKa = 7.97QGKK55 pKa = 8.61VYY57 pKa = 10.42FMYY60 pKa = 10.71KK61 pKa = 9.93KK62 pKa = 9.71GNKK65 pKa = 8.42MKK67 pKa = 9.56WLHH70 pKa = 5.69RR71 pKa = 11.84SIMGLKK77 pKa = 9.95EE78 pKa = 4.0GDD80 pKa = 3.62PAIVDD85 pKa = 4.12HH86 pKa = 6.92INRR89 pKa = 11.84NPSDD93 pKa = 3.45NRR95 pKa = 11.84RR96 pKa = 11.84CNLRR100 pKa = 11.84IATRR104 pKa = 11.84QINSRR109 pKa = 11.84NATNKK114 pKa = 9.33VSKK117 pKa = 10.47HH118 pKa = 4.51GYY120 pKa = 8.6KK121 pKa = 9.33WVAKK125 pKa = 10.02NRR127 pKa = 11.84NKK129 pKa = 10.03YY130 pKa = 8.53AANVRR135 pKa = 11.84HH136 pKa = 6.26NYY138 pKa = 8.64QKK140 pKa = 11.08VYY142 pKa = 10.21LGNYY146 pKa = 7.18DD147 pKa = 3.7TPLEE151 pKa = 4.04AHH153 pKa = 6.43RR154 pKa = 11.84VANRR158 pKa = 11.84WVHH161 pKa = 5.49EE162 pKa = 4.42NIGSEE167 pKa = 4.16FCVRR171 pKa = 11.84EE172 pKa = 4.31PIRR175 pKa = 11.84LNN177 pKa = 3.34
Molecular weight: 20.75 kDa
Isoelectric point according different methods:
Peptides (in silico digests for buttom-up proteomics)
Below you can find in silico digests of the whole proteome with Trypsin, Chymotrypsin, Trypsin+LysC, LysN, ArgC proteases suitable for different mass spec machines.| Try ESI |
 |
|---|
| ChTry ESI |
 |
|---|
| ArgC ESI |
 |
|---|
| LysN ESI |
 |
|---|
| TryLysC ESI |
 |
|---|
| Try MALDI |
 |
|---|
| ChTry MALDI |
 |
|---|
| ArgC MALDI |
 |
|---|
| LysN MALDI |
 |
|---|
| TryLysC MALDI |
 |
|---|
| Try LTQ |
 |
|---|
| ChTry LTQ |
 |
|---|
| ArgC LTQ |
 |
|---|
| LysN LTQ |
 |
|---|
| TryLysC LTQ |
 |
|---|
| Try MSlow |
 |
|---|
| ChTry MSlow |
 |
|---|
| ArgC MSlow |
 |
|---|
| LysN MSlow |
 |
|---|
| TryLysC MSlow |
 |
|---|
| Try MShigh |
 |
|---|
| ChTry MShigh |
 |
|---|
| ArgC MShigh |
 |
|---|
| LysN MShigh |
 |
|---|
| TryLysC MShigh |
 |
|---|
General Statistics
Number of major isoforms |
Number of additional isoforms |
Number of all proteins |
Number of amino acids |
Min. Seq. Length |
Max. Seq. Length |
Avg. Seq. Length |
Avg. Mol. Weight |
|---|---|---|---|---|---|---|---|
0 |
39748 |
35 |
1129 |
203.8 |
23.12 |
Amino acid frequency
Ala |
Cys |
Asp |
Glu |
Phe |
Gly |
His |
Ile |
Lys |
Leu |
|---|---|---|---|---|---|---|---|---|---|
5.402 ± 0.193 | 0.941 ± 0.063 |
6.785 ± 0.137 | 8.099 ± 0.269 |
3.5 ± 0.124 | 6.755 ± 0.194 |
1.887 ± 0.103 | 6.363 ± 0.15 |
8.0 ± 0.252 | 8.066 ± 0.178 |
Met |
Asn |
Gln |
Pro |
Arg |
Ser |
Thr |
Val |
Trp |
Tyr |
|---|---|---|---|---|---|---|---|---|---|
2.717 ± 0.087 | 5.054 ± 0.164 |
3.341 ± 0.141 | 3.376 ± 0.12 |
4.612 ± 0.114 | 6.423 ± 0.162 |
5.912 ± 0.181 | 7.346 ± 0.178 |
1.122 ± 0.051 | 4.3 ± 0.125 |
Most of the basic statistics you can see at this page can be downloaded from this CSV file
Proteome-pI is available under Creative Commons Attribution-NoDerivs license, for more details see here
| Reference: Kozlowski LP. Proteome-pI 2.0: Proteome Isoelectric Point Database Update. Nucleic Acids Res. 2021, doi: 10.1093/nar/gkab944 | Contact: Lukasz P. Kozlowski |
