Roseibium sp. RKSG952
Taxonomy: cellular organisms; Bacteria; Proteobacteria; Alphaproteobacteria; Hyphomicrobiales; Stappiaceae; Roseibium; unclassified Roseibium
Average proteome isoelectric point is 6.08
Get precalculated fractions of proteins

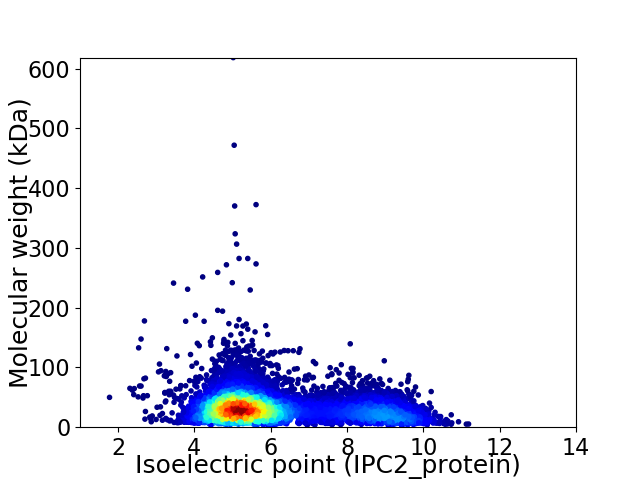
Virtual 2D-PAGE plot for 9448 proteins (isoelectric point calculated using IPC2_protein)
Get csv file with sequences according to given criteria:
* You can choose from 21 different methods for calculating isoelectric point
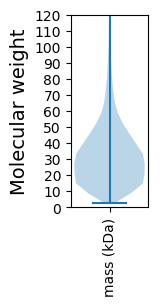
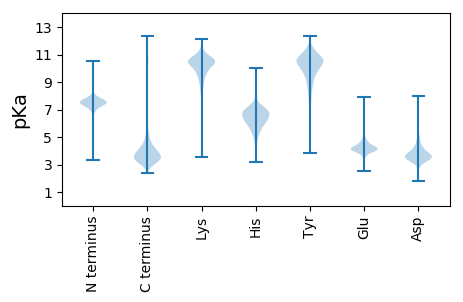
Summary statistics related to proteome-wise predictions


Protein with the lowest isoelectric point:
>tr|A0A6N7ZS53|A0A6N7ZS53_9RHOB Phage portal protein OS=Roseibium sp. RKSG952 OX=2529384 GN=E1297_06985 PE=4 SV=1
MM1 pKa = 7.21HH2 pKa = 7.26VSTGLEE8 pKa = 3.8GLDD11 pKa = 3.69AKK13 pKa = 10.92LEE15 pKa = 4.26HH16 pKa = 6.85LSSEE20 pKa = 4.33DD21 pKa = 3.74LQLLLNFVAGNTLFTLYY38 pKa = 10.66HH39 pKa = 6.29EE40 pKa = 5.08AGHH43 pKa = 5.6MLISEE48 pKa = 4.93LGLPVLGQEE57 pKa = 4.22EE58 pKa = 4.38DD59 pKa = 3.78AVDD62 pKa = 3.71NLATVMMLSDD72 pKa = 4.42DD73 pKa = 4.1TRR75 pKa = 11.84DD76 pKa = 3.34MDD78 pKa = 4.21QLLSQAMIGWFLIASQNHH96 pKa = 6.77DD97 pKa = 3.35NLVFYY102 pKa = 10.95GEE104 pKa = 4.99HH105 pKa = 7.34DD106 pKa = 4.3LDD108 pKa = 3.95LQRR111 pKa = 11.84GYY113 pKa = 11.74QMLCLMVGADD123 pKa = 3.65PDD125 pKa = 3.94AFEE128 pKa = 6.02DD129 pKa = 4.42LANDD133 pKa = 3.94LDD135 pKa = 4.12LPEE138 pKa = 5.1DD139 pKa = 3.7RR140 pKa = 11.84RR141 pKa = 11.84EE142 pKa = 4.05TCAFDD147 pKa = 3.84YY148 pKa = 9.95EE149 pKa = 4.31QSADD153 pKa = 3.35SWDD156 pKa = 3.98LVTDD160 pKa = 4.14PFLRR164 pKa = 11.84PEE166 pKa = 3.86GHH168 pKa = 6.42RR169 pKa = 11.84GDD171 pKa = 5.16RR172 pKa = 11.84ITVAYY177 pKa = 8.45AQPEE181 pKa = 4.12PGQASMALFLQEE193 pKa = 4.24SEE195 pKa = 4.13LMEE198 pKa = 4.35MVAEE202 pKa = 4.76DD203 pKa = 4.97LDD205 pKa = 4.04GLYY208 pKa = 10.84ALPDD212 pKa = 4.4KK213 pKa = 10.58ITFQAMACGEE223 pKa = 4.22EE224 pKa = 3.88NAYY227 pKa = 9.45WDD229 pKa = 3.62PQARR233 pKa = 11.84EE234 pKa = 3.66MTLCYY239 pKa = 10.49EE240 pKa = 4.3LMAGFSEE247 pKa = 4.84IFLDD251 pKa = 5.43LLGTDD256 pKa = 3.87EE257 pKa = 4.43
MM1 pKa = 7.21HH2 pKa = 7.26VSTGLEE8 pKa = 3.8GLDD11 pKa = 3.69AKK13 pKa = 10.92LEE15 pKa = 4.26HH16 pKa = 6.85LSSEE20 pKa = 4.33DD21 pKa = 3.74LQLLLNFVAGNTLFTLYY38 pKa = 10.66HH39 pKa = 6.29EE40 pKa = 5.08AGHH43 pKa = 5.6MLISEE48 pKa = 4.93LGLPVLGQEE57 pKa = 4.22EE58 pKa = 4.38DD59 pKa = 3.78AVDD62 pKa = 3.71NLATVMMLSDD72 pKa = 4.42DD73 pKa = 4.1TRR75 pKa = 11.84DD76 pKa = 3.34MDD78 pKa = 4.21QLLSQAMIGWFLIASQNHH96 pKa = 6.77DD97 pKa = 3.35NLVFYY102 pKa = 10.95GEE104 pKa = 4.99HH105 pKa = 7.34DD106 pKa = 4.3LDD108 pKa = 3.95LQRR111 pKa = 11.84GYY113 pKa = 11.74QMLCLMVGADD123 pKa = 3.65PDD125 pKa = 3.94AFEE128 pKa = 6.02DD129 pKa = 4.42LANDD133 pKa = 3.94LDD135 pKa = 4.12LPEE138 pKa = 5.1DD139 pKa = 3.7RR140 pKa = 11.84RR141 pKa = 11.84EE142 pKa = 4.05TCAFDD147 pKa = 3.84YY148 pKa = 9.95EE149 pKa = 4.31QSADD153 pKa = 3.35SWDD156 pKa = 3.98LVTDD160 pKa = 4.14PFLRR164 pKa = 11.84PEE166 pKa = 3.86GHH168 pKa = 6.42RR169 pKa = 11.84GDD171 pKa = 5.16RR172 pKa = 11.84ITVAYY177 pKa = 8.45AQPEE181 pKa = 4.12PGQASMALFLQEE193 pKa = 4.24SEE195 pKa = 4.13LMEE198 pKa = 4.35MVAEE202 pKa = 4.76DD203 pKa = 4.97LDD205 pKa = 4.04GLYY208 pKa = 10.84ALPDD212 pKa = 4.4KK213 pKa = 10.58ITFQAMACGEE223 pKa = 4.22EE224 pKa = 3.88NAYY227 pKa = 9.45WDD229 pKa = 3.62PQARR233 pKa = 11.84EE234 pKa = 3.66MTLCYY239 pKa = 10.49EE240 pKa = 4.3LMAGFSEE247 pKa = 4.84IFLDD251 pKa = 5.43LLGTDD256 pKa = 3.87EE257 pKa = 4.43
Molecular weight: 28.83 kDa
Isoelectric point according different methods:
Protein with the highest isoelectric point:
>tr|A0A6N7ZVZ3|A0A6N7ZVZ3_9RHOB Glutamine--fructose-6-phosphate aminotransferase [isomerizing] OS=Roseibium sp. RKSG952 OX=2529384 GN=glmS PE=3 SV=1
MM1 pKa = 7.35KK2 pKa = 9.4RR3 pKa = 11.84TYY5 pKa = 10.2QPSRR9 pKa = 11.84LVRR12 pKa = 11.84KK13 pKa = 9.21RR14 pKa = 11.84RR15 pKa = 11.84HH16 pKa = 4.48GFRR19 pKa = 11.84ARR21 pKa = 11.84MATKK25 pKa = 10.4NGRR28 pKa = 11.84QVLARR33 pKa = 11.84RR34 pKa = 11.84RR35 pKa = 11.84AKK37 pKa = 9.93GRR39 pKa = 11.84KK40 pKa = 8.85RR41 pKa = 11.84LSAA44 pKa = 3.96
MM1 pKa = 7.35KK2 pKa = 9.4RR3 pKa = 11.84TYY5 pKa = 10.2QPSRR9 pKa = 11.84LVRR12 pKa = 11.84KK13 pKa = 9.21RR14 pKa = 11.84RR15 pKa = 11.84HH16 pKa = 4.48GFRR19 pKa = 11.84ARR21 pKa = 11.84MATKK25 pKa = 10.4NGRR28 pKa = 11.84QVLARR33 pKa = 11.84RR34 pKa = 11.84RR35 pKa = 11.84AKK37 pKa = 9.93GRR39 pKa = 11.84KK40 pKa = 8.85RR41 pKa = 11.84LSAA44 pKa = 3.96
Molecular weight: 5.31 kDa
Isoelectric point according different methods:
Peptides (in silico digests for buttom-up proteomics)
Below you can find in silico digests of the whole proteome with Trypsin, Chymotrypsin, Trypsin+LysC, LysN, ArgC proteases suitable for different mass spec machines.| Try ESI |
 |
|---|
| ChTry ESI |
 |
|---|
| ArgC ESI |
 |
|---|
| LysN ESI |
 |
|---|
| TryLysC ESI |
 |
|---|
| Try MALDI |
 |
|---|
| ChTry MALDI |
 |
|---|
| ArgC MALDI |
 |
|---|
| LysN MALDI |
 |
|---|
| TryLysC MALDI |
 |
|---|
| Try LTQ |
 |
|---|
| ChTry LTQ |
 |
|---|
| ArgC LTQ |
 |
|---|
| LysN LTQ |
 |
|---|
| TryLysC LTQ |
 |
|---|
| Try MSlow |
 |
|---|
| ChTry MSlow |
 |
|---|
| ArgC MSlow |
 |
|---|
| LysN MSlow |
 |
|---|
| TryLysC MSlow |
 |
|---|
| Try MShigh |
 |
|---|
| ChTry MShigh |
 |
|---|
| ArgC MShigh |
 |
|---|
| LysN MShigh |
 |
|---|
| TryLysC MShigh |
 |
|---|
General Statistics
Number of major isoforms |
Number of additional isoforms |
Number of all proteins |
Number of amino acids |
Min. Seq. Length |
Max. Seq. Length |
Avg. Seq. Length |
Avg. Mol. Weight |
|---|---|---|---|---|---|---|---|
0 |
2960375 |
24 |
5708 |
313.3 |
34.2 |
Amino acid frequency
Ala |
Cys |
Asp |
Glu |
Phe |
Gly |
His |
Ile |
Lys |
Leu |
|---|---|---|---|---|---|---|---|---|---|
11.041 ± 0.03 | 0.929 ± 0.009 |
6.119 ± 0.025 | 6.118 ± 0.022 |
3.943 ± 0.016 | 8.41 ± 0.03 |
2.068 ± 0.011 | 5.424 ± 0.019 |
3.66 ± 0.019 | 9.913 ± 0.027 |
Met |
Asn |
Gln |
Pro |
Arg |
Ser |
Thr |
Val |
Trp |
Tyr |
|---|---|---|---|---|---|---|---|---|---|
2.599 ± 0.013 | 3.003 ± 0.015 |
4.904 ± 0.017 | 3.348 ± 0.013 |
6.255 ± 0.029 | 5.805 ± 0.019 |
5.469 ± 0.019 | 7.23 ± 0.021 |
1.36 ± 0.01 | 2.4 ± 0.015 |
Most of the basic statistics you can see at this page can be downloaded from this CSV file
Proteome-pI is available under Creative Commons Attribution-NoDerivs license, for more details see here
| Reference: Kozlowski LP. Proteome-pI 2.0: Proteome Isoelectric Point Database Update. Nucleic Acids Res. 2021, doi: 10.1093/nar/gkab944 | Contact: Lukasz P. Kozlowski |
