Peniophora sp. CBMAI 1063
Taxonomy: cellular organisms; Eukaryota; Opisthokonta; Fungi; Dikarya; Basidiomycota; Agaricomycotina; Agaricomycetes; Agaricomycetes incertae sedis; Russulales; Peniophoraceae; Peniophora; unclassified Peniophora
Average proteome isoelectric point is 6.43
Get precalculated fractions of proteins

Virtual 2D-PAGE plot for 17685 proteins (isoelectric point calculated using IPC2_protein)
Get csv file with sequences according to given criteria:
* You can choose from 21 different methods for calculating isoelectric point
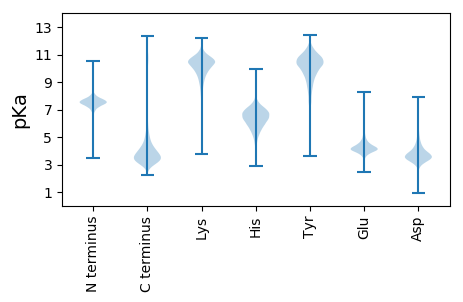
Summary statistics related to proteome-wise predictions


Protein with the lowest isoelectric point:
>tr|A0A5E3XFB8|A0A5E3XFB8_9AGAM JmjC domain-containing protein OS=Peniophora sp. CBMAI 1063 OX=718367 GN=PNH_LOCUS12441 PE=4 SV=1
MM1 pKa = 6.32MAGWASAWNVTVLPLGDD18 pKa = 4.21SITYY22 pKa = 9.39GWEE25 pKa = 3.88SSDD28 pKa = 3.19GNGYY32 pKa = 9.98RR33 pKa = 11.84EE34 pKa = 4.17GLLEE38 pKa = 5.25LIEE41 pKa = 4.47ASGNAVDD48 pKa = 4.86YY49 pKa = 10.76IGSIQAGSMADD60 pKa = 3.26NWNDD64 pKa = 3.6GYY66 pKa = 10.55IGCTIEE72 pKa = 4.67QIATNGVSALQMVPKK87 pKa = 10.5VVLLLAGTNDD97 pKa = 2.78INYY100 pKa = 9.78QEE102 pKa = 5.11DD103 pKa = 4.01LANAPARR110 pKa = 11.84LDD112 pKa = 3.6SLIDD116 pKa = 4.06EE117 pKa = 4.79IFSYY121 pKa = 10.37TPQATVLVSDD131 pKa = 4.49IPLIVDD137 pKa = 3.56DD138 pKa = 4.37TLEE141 pKa = 4.44PLVKK145 pKa = 9.71TYY147 pKa = 11.02NAGVLDD153 pKa = 4.2LVNGRR158 pKa = 11.84IADD161 pKa = 3.94GQKK164 pKa = 10.22LVHH167 pKa = 6.24VSLDD171 pKa = 3.36ALTSSEE177 pKa = 4.4MADD180 pKa = 3.22EE181 pKa = 4.22LHH183 pKa = 7.03PNDD186 pKa = 4.3EE187 pKa = 4.86GYY189 pKa = 10.52QVLAKK194 pKa = 10.18AWYY197 pKa = 8.78TGVQTAAAKK206 pKa = 10.16GWIASS211 pKa = 3.68
MM1 pKa = 6.32MAGWASAWNVTVLPLGDD18 pKa = 4.21SITYY22 pKa = 9.39GWEE25 pKa = 3.88SSDD28 pKa = 3.19GNGYY32 pKa = 9.98RR33 pKa = 11.84EE34 pKa = 4.17GLLEE38 pKa = 5.25LIEE41 pKa = 4.47ASGNAVDD48 pKa = 4.86YY49 pKa = 10.76IGSIQAGSMADD60 pKa = 3.26NWNDD64 pKa = 3.6GYY66 pKa = 10.55IGCTIEE72 pKa = 4.67QIATNGVSALQMVPKK87 pKa = 10.5VVLLLAGTNDD97 pKa = 2.78INYY100 pKa = 9.78QEE102 pKa = 5.11DD103 pKa = 4.01LANAPARR110 pKa = 11.84LDD112 pKa = 3.6SLIDD116 pKa = 4.06EE117 pKa = 4.79IFSYY121 pKa = 10.37TPQATVLVSDD131 pKa = 4.49IPLIVDD137 pKa = 3.56DD138 pKa = 4.37TLEE141 pKa = 4.44PLVKK145 pKa = 9.71TYY147 pKa = 11.02NAGVLDD153 pKa = 4.2LVNGRR158 pKa = 11.84IADD161 pKa = 3.94GQKK164 pKa = 10.22LVHH167 pKa = 6.24VSLDD171 pKa = 3.36ALTSSEE177 pKa = 4.4MADD180 pKa = 3.22EE181 pKa = 4.22LHH183 pKa = 7.03PNDD186 pKa = 4.3EE187 pKa = 4.86GYY189 pKa = 10.52QVLAKK194 pKa = 10.18AWYY197 pKa = 8.78TGVQTAAAKK206 pKa = 10.16GWIASS211 pKa = 3.68
Molecular weight: 22.53 kDa
Isoelectric point according different methods:
Protein with the highest isoelectric point:
>tr|A0A5E3WZ03|A0A5E3WZ03_9AGAM Uncharacterized protein OS=Peniophora sp. CBMAI 1063 OX=718367 GN=PNH_LOCUS6806 PE=4 SV=1
MM1 pKa = 7.39ATPAMSPTATQPSQGRR17 pKa = 11.84PSTSPRR23 pKa = 11.84LGKK26 pKa = 10.4SGLISSSKK34 pKa = 9.83RR35 pKa = 11.84AAPSTMARR43 pKa = 11.84SRR45 pKa = 11.84TTPSTKK51 pKa = 10.16SDD53 pKa = 3.17TKK55 pKa = 7.97TTRR58 pKa = 11.84LPKK61 pKa = 10.22PSANTAKK68 pKa = 10.01TSPRR72 pKa = 11.84VKK74 pKa = 9.84TSSVPSKK81 pKa = 10.69VQAATAASKK90 pKa = 11.04AKK92 pKa = 9.21TAAPLVKK99 pKa = 9.79TKK101 pKa = 10.47AAPISSASKK110 pKa = 9.3VPAAPRR116 pKa = 11.84HH117 pKa = 5.43SSIQASPKK125 pKa = 9.66LAAKK129 pKa = 10.31ARR131 pKa = 11.84TASVASPKK139 pKa = 10.46AKK141 pKa = 9.29PAPRR145 pKa = 11.84ISKK148 pKa = 10.34LPSSPNKK155 pKa = 9.58AQAPARR161 pKa = 11.84AVSAATRR168 pKa = 11.84SAPVTRR174 pKa = 11.84SVGKK178 pKa = 8.59STGSSGAKK186 pKa = 8.86PAPSVVKK193 pKa = 10.37ARR195 pKa = 11.84PASTFSATSKK205 pKa = 7.38TTVRR209 pKa = 11.84RR210 pKa = 11.84ASVLSRR216 pKa = 11.84ARR218 pKa = 11.84TEE220 pKa = 3.83PATAASGIIASPPATPTAPTKK241 pKa = 9.07GTRR244 pKa = 11.84SGRR247 pKa = 11.84SVGWAA252 pKa = 3.08
MM1 pKa = 7.39ATPAMSPTATQPSQGRR17 pKa = 11.84PSTSPRR23 pKa = 11.84LGKK26 pKa = 10.4SGLISSSKK34 pKa = 9.83RR35 pKa = 11.84AAPSTMARR43 pKa = 11.84SRR45 pKa = 11.84TTPSTKK51 pKa = 10.16SDD53 pKa = 3.17TKK55 pKa = 7.97TTRR58 pKa = 11.84LPKK61 pKa = 10.22PSANTAKK68 pKa = 10.01TSPRR72 pKa = 11.84VKK74 pKa = 9.84TSSVPSKK81 pKa = 10.69VQAATAASKK90 pKa = 11.04AKK92 pKa = 9.21TAAPLVKK99 pKa = 9.79TKK101 pKa = 10.47AAPISSASKK110 pKa = 9.3VPAAPRR116 pKa = 11.84HH117 pKa = 5.43SSIQASPKK125 pKa = 9.66LAAKK129 pKa = 10.31ARR131 pKa = 11.84TASVASPKK139 pKa = 10.46AKK141 pKa = 9.29PAPRR145 pKa = 11.84ISKK148 pKa = 10.34LPSSPNKK155 pKa = 9.58AQAPARR161 pKa = 11.84AVSAATRR168 pKa = 11.84SAPVTRR174 pKa = 11.84SVGKK178 pKa = 8.59STGSSGAKK186 pKa = 8.86PAPSVVKK193 pKa = 10.37ARR195 pKa = 11.84PASTFSATSKK205 pKa = 7.38TTVRR209 pKa = 11.84RR210 pKa = 11.84ASVLSRR216 pKa = 11.84ARR218 pKa = 11.84TEE220 pKa = 3.83PATAASGIIASPPATPTAPTKK241 pKa = 9.07GTRR244 pKa = 11.84SGRR247 pKa = 11.84SVGWAA252 pKa = 3.08
Molecular weight: 25.17 kDa
Isoelectric point according different methods:
Peptides (in silico digests for buttom-up proteomics)
Below you can find in silico digests of the whole proteome with Trypsin, Chymotrypsin, Trypsin+LysC, LysN, ArgC proteases suitable for different mass spec machines.| Try ESI |
 |
|---|
| ChTry ESI |
|
|---|
| ArgC ESI |
|
|---|
| LysN ESI |
|
|---|
| TryLysC ESI |
|
|---|
| Try MALDI |
|
|---|
| ChTry MALDI |
|
|---|
| ArgC MALDI |
|
|---|
| LysN MALDI |
|
|---|
| TryLysC MALDI |
|
|---|
| Try LTQ |
|
|---|
| ChTry LTQ |
|
|---|
| ArgC LTQ |
|
|---|
| LysN LTQ |
|
|---|
| TryLysC LTQ |
|
|---|
| Try MSlow |
|
|---|
| ChTry MSlow |
|
|---|
| ArgC MSlow |
|
|---|
| LysN MSlow |
|
|---|
| TryLysC MSlow |
|
|---|
| Try MShigh |
|
|---|
| ChTry MShigh |
|
|---|
| ArgC MShigh |
|
|---|
| LysN MShigh |
|
|---|
| TryLysC MShigh |
|
|---|
General Statistics
Number of major isoforms |
Number of additional isoforms |
Number of all proteins |
Number of amino acids |
Min. Seq. Length |
Max. Seq. Length |
Avg. Seq. Length |
Avg. Mol. Weight |
|---|---|---|---|---|---|---|---|
8329052 |
16 |
5014 |
471.0 |
51.77 |
Amino acid frequency
Ala |
Cys |
Asp |
Glu |
Phe |
Gly |
His |
Ile |
Lys |
Leu |
|---|---|---|---|---|---|---|---|---|---|
9.984 ± 0.021 | 1.212 ± 0.007 |
5.834 ± 0.011 | 5.877 ± 0.016 |
3.481 ± 0.012 | 6.6 ± 0.017 |
2.6 ± 0.008 | 4.342 ± 0.013 |
3.8 ± 0.016 | 9.431 ± 0.024 |
Met |
Asn |
Gln |
Pro |
Arg |
Ser |
Thr |
Val |
Trp |
Tyr |
|---|---|---|---|---|---|---|---|---|---|
2.034 ± 0.007 | 3.023 ± 0.009 |
6.7 ± 0.025 | 3.48 ± 0.01 |
6.795 ± 0.016 | 8.259 ± 0.022 |
5.945 ± 0.012 | 6.449 ± 0.013 |
1.488 ± 0.007 | 2.608 ± 0.009 |
Most of the basic statistics you can see at this page can be downloaded from this CSV file
See this proteome in:

Proteome-pI is available under Creative Commons Attribution-NoDerivs license, for more details see here
| Reference: Kozlowski LP. Proteome-pI 2.0: Proteome Isoelectric Point Database Update. Nucleic Acids Res. 2021, doi: 10.1093/nar/gkab944 | Contact: Lukasz P. Kozlowski |