Marinobacter sp. BSs20148
Taxonomy: cellular organisms; Bacteria; Proteobacteria; Gammaproteobacteria; Alteromonadales; Alteromonadaceae; Marinobacter; unclassified Marinobacter
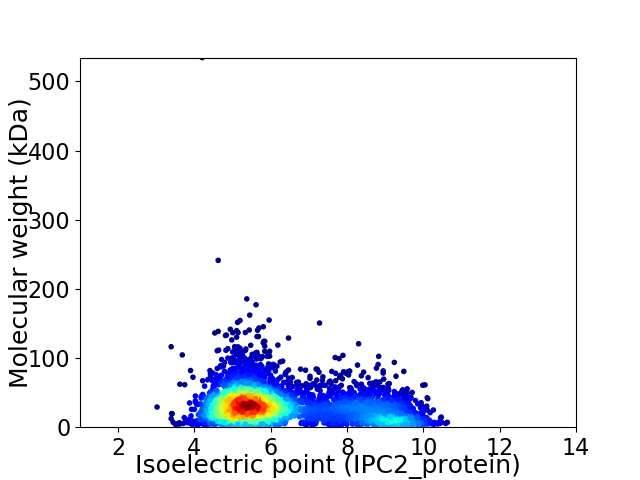
Average proteome isoelectric point is 6.33
Get precalculated fractions of proteins

Virtual 2D-PAGE plot for 3885 proteins (isoelectric point calculated using IPC2_protein)
Get csv file with sequences according to given criteria:
* You can choose from 21 different methods for calculating isoelectric point
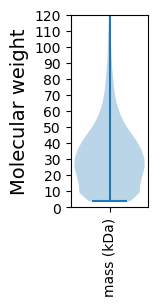
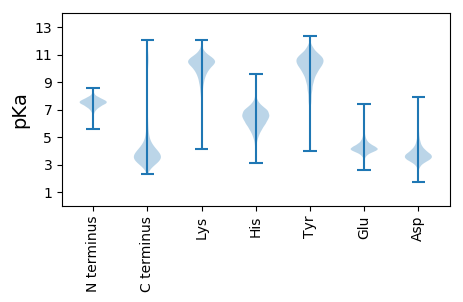
Summary statistics related to proteome-wise predictions


Protein with the lowest isoelectric point:
>tr|M1FC69|M1FC69_9ALTE Proline iminopeptidase OS=Marinobacter sp. BSs20148 OX=490759 GN=pip PE=3 SV=1
MM1 pKa = 7.45SVVQQQVSAPLFFSNSAAAKK21 pKa = 9.59AKK23 pKa = 10.27EE24 pKa = 4.29LIDD27 pKa = 3.73EE28 pKa = 4.84EE29 pKa = 4.94GNADD33 pKa = 3.72LKK35 pKa = 11.22LRR37 pKa = 11.84VYY39 pKa = 9.06VTGGGCSGFQYY50 pKa = 10.84GFSFDD55 pKa = 4.68DD56 pKa = 4.18AQDD59 pKa = 4.24DD60 pKa = 3.85EE61 pKa = 4.54DD62 pKa = 4.74TIIEE66 pKa = 4.06RR67 pKa = 11.84DD68 pKa = 3.83GVKK71 pKa = 10.65LLVDD75 pKa = 3.8PMSYY79 pKa = 10.37QYY81 pKa = 11.59LVGSTVDD88 pKa = 3.55YY89 pKa = 11.59LEE91 pKa = 4.76GLQGSQFVVNNPNASSTCGCGSSFSII117 pKa = 5.02
MM1 pKa = 7.45SVVQQQVSAPLFFSNSAAAKK21 pKa = 9.59AKK23 pKa = 10.27EE24 pKa = 4.29LIDD27 pKa = 3.73EE28 pKa = 4.84EE29 pKa = 4.94GNADD33 pKa = 3.72LKK35 pKa = 11.22LRR37 pKa = 11.84VYY39 pKa = 9.06VTGGGCSGFQYY50 pKa = 10.84GFSFDD55 pKa = 4.68DD56 pKa = 4.18AQDD59 pKa = 4.24DD60 pKa = 3.85EE61 pKa = 4.54DD62 pKa = 4.74TIIEE66 pKa = 4.06RR67 pKa = 11.84DD68 pKa = 3.83GVKK71 pKa = 10.65LLVDD75 pKa = 3.8PMSYY79 pKa = 10.37QYY81 pKa = 11.59LVGSTVDD88 pKa = 3.55YY89 pKa = 11.59LEE91 pKa = 4.76GLQGSQFVVNNPNASSTCGCGSSFSII117 pKa = 5.02
Molecular weight: 12.51 kDa
Isoelectric point according different methods:
Protein with the highest isoelectric point:
>tr|M1FMA5|M1FMA5_9ALTE Uncharacterized protein OS=Marinobacter sp. BSs20148 OX=490759 GN=MRBBS_3512 PE=4 SV=1
MM1 pKa = 7.66RR2 pKa = 11.84PVPISIAVVVMLVSLSGAAKK22 pKa = 9.74ADD24 pKa = 3.68YY25 pKa = 10.48YY26 pKa = 11.17RR27 pKa = 11.84WTDD30 pKa = 3.28ANGVTHH36 pKa = 6.82FTDD39 pKa = 3.41KK40 pKa = 10.88PKK42 pKa = 10.62TPGSQAINFHH52 pKa = 6.07QPTVIPIADD61 pKa = 3.51NNRR64 pKa = 11.84RR65 pKa = 11.84RR66 pKa = 11.84GDD68 pKa = 3.56RR69 pKa = 11.84LQGLQPDD76 pKa = 4.16TPKK79 pKa = 11.08NSVQGKK85 pKa = 6.93AQKK88 pKa = 9.48PAQANAAEE96 pKa = 4.41IAQQKK101 pKa = 7.36TCEE104 pKa = 4.05NYY106 pKa = 10.48ADD108 pKa = 4.71RR109 pKa = 11.84IGNIEE114 pKa = 3.76SRR116 pKa = 11.84LRR118 pKa = 11.84AGGYY122 pKa = 8.5SASRR126 pKa = 11.84GNRR129 pKa = 11.84LRR131 pKa = 11.84RR132 pKa = 11.84DD133 pKa = 3.42RR134 pKa = 11.84RR135 pKa = 11.84EE136 pKa = 3.94LASKK140 pKa = 8.75RR141 pKa = 11.84TWEE144 pKa = 4.07CLRR147 pKa = 11.84RR148 pKa = 3.76
MM1 pKa = 7.66RR2 pKa = 11.84PVPISIAVVVMLVSLSGAAKK22 pKa = 9.74ADD24 pKa = 3.68YY25 pKa = 10.48YY26 pKa = 11.17RR27 pKa = 11.84WTDD30 pKa = 3.28ANGVTHH36 pKa = 6.82FTDD39 pKa = 3.41KK40 pKa = 10.88PKK42 pKa = 10.62TPGSQAINFHH52 pKa = 6.07QPTVIPIADD61 pKa = 3.51NNRR64 pKa = 11.84RR65 pKa = 11.84RR66 pKa = 11.84GDD68 pKa = 3.56RR69 pKa = 11.84LQGLQPDD76 pKa = 4.16TPKK79 pKa = 11.08NSVQGKK85 pKa = 6.93AQKK88 pKa = 9.48PAQANAAEE96 pKa = 4.41IAQQKK101 pKa = 7.36TCEE104 pKa = 4.05NYY106 pKa = 10.48ADD108 pKa = 4.71RR109 pKa = 11.84IGNIEE114 pKa = 3.76SRR116 pKa = 11.84LRR118 pKa = 11.84AGGYY122 pKa = 8.5SASRR126 pKa = 11.84GNRR129 pKa = 11.84LRR131 pKa = 11.84RR132 pKa = 11.84DD133 pKa = 3.42RR134 pKa = 11.84RR135 pKa = 11.84EE136 pKa = 3.94LASKK140 pKa = 8.75RR141 pKa = 11.84TWEE144 pKa = 4.07CLRR147 pKa = 11.84RR148 pKa = 3.76
Molecular weight: 16.51 kDa
Isoelectric point according different methods:
Peptides (in silico digests for buttom-up proteomics)
Below you can find in silico digests of the whole proteome with Trypsin, Chymotrypsin, Trypsin+LysC, LysN, ArgC proteases suitable for different mass spec machines.| Try ESI |
 |
|---|
| ChTry ESI |
 |
|---|
| ArgC ESI |
 |
|---|
| LysN ESI |
 |
|---|
| TryLysC ESI |
 |
|---|
| Try MALDI |
 |
|---|
| ChTry MALDI |
 |
|---|
| ArgC MALDI |
 |
|---|
| LysN MALDI |
 |
|---|
| TryLysC MALDI |
 |
|---|
| Try LTQ |
 |
|---|
| ChTry LTQ |
 |
|---|
| ArgC LTQ |
 |
|---|
| LysN LTQ |
 |
|---|
| TryLysC LTQ |
 |
|---|
| Try MSlow |
 |
|---|
| ChTry MSlow |
 |
|---|
| ArgC MSlow |
 |
|---|
| LysN MSlow |
 |
|---|
| TryLysC MSlow |
 |
|---|
| Try MShigh |
 |
|---|
| ChTry MShigh |
 |
|---|
| ArgC MShigh |
 |
|---|
| LysN MShigh |
 |
|---|
| TryLysC MShigh |
 |
|---|
General Statistics
Number of major isoforms |
Number of additional isoforms |
Number of all proteins |
Number of amino acids |
Min. Seq. Length |
Max. Seq. Length |
Avg. Seq. Length |
Avg. Mol. Weight |
|---|---|---|---|---|---|---|---|
0 |
1180275 |
37 |
5235 |
303.8 |
33.4 |
Amino acid frequency
Ala |
Cys |
Asp |
Glu |
Phe |
Gly |
His |
Ile |
Lys |
Leu |
|---|---|---|---|---|---|---|---|---|---|
10.21 ± 0.046 | 0.99 ± 0.014 |
5.497 ± 0.036 | 5.861 ± 0.041 |
3.851 ± 0.03 | 7.788 ± 0.041 |
2.208 ± 0.02 | 5.526 ± 0.031 |
3.807 ± 0.037 | 10.818 ± 0.06 |
Met |
Asn |
Gln |
Pro |
Arg |
Ser |
Thr |
Val |
Trp |
Tyr |
|---|---|---|---|---|---|---|---|---|---|
2.697 ± 0.018 | 3.516 ± 0.028 |
4.55 ± 0.026 | 4.266 ± 0.032 |
6.005 ± 0.033 | 6.068 ± 0.029 |
5.185 ± 0.028 | 7.298 ± 0.031 |
1.339 ± 0.017 | 2.521 ± 0.021 |
Most of the basic statistics you can see at this page can be downloaded from this CSV file
Proteome-pI is available under Creative Commons Attribution-NoDerivs license, for more details see here
| Reference: Kozlowski LP. Proteome-pI 2.0: Proteome Isoelectric Point Database Update. Nucleic Acids Res. 2021, doi: 10.1093/nar/gkab944 | Contact: Lukasz P. Kozlowski |
