Gregarina niphandrodes (Septate eugregarine)
Taxonomy: cellular organisms; Eukaryota; Sar; Alveolata; Apicomplexa; Conoidasida; Gregarinasina; Eugregarinorida; Gregarinidae; Gregarina
Average proteome isoelectric point is 6.38
Get precalculated fractions of proteins

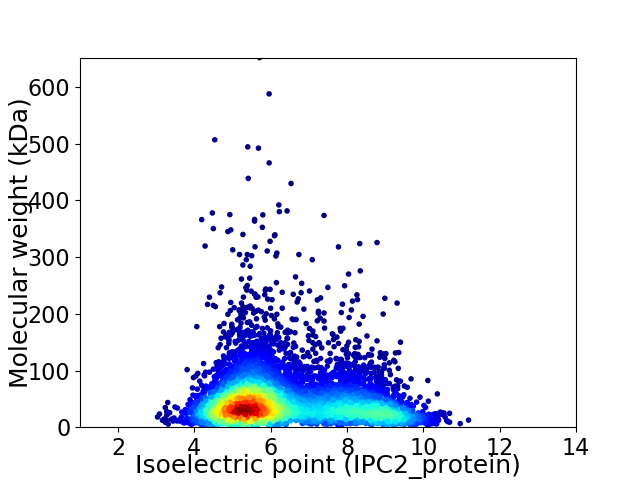
Virtual 2D-PAGE plot for 6341 proteins (isoelectric point calculated using IPC2_protein)
Get csv file with sequences according to given criteria:
* You can choose from 21 different methods for calculating isoelectric point
Summary statistics related to proteome-wise predictions


Protein with the lowest isoelectric point:
>tr|A0A023B553|A0A023B553_GRENI PLD-like domain protein OS=Gregarina niphandrodes OX=110365 GN=GNI_095850 PE=4 SV=1
MM1 pKa = 7.45KK2 pKa = 10.5CLGAFFASVVLVSGGLSTYY21 pKa = 11.01SDD23 pKa = 3.69TCFLPIDD30 pKa = 4.16LLLVQDD36 pKa = 3.99TTGSFMDD43 pKa = 4.84DD44 pKa = 3.5LPNVSKK50 pKa = 10.99AIPTLVSSVLEE61 pKa = 4.21NNPGSHH67 pKa = 6.84FGAVEE72 pKa = 4.43FKK74 pKa = 10.71DD75 pKa = 3.51KK76 pKa = 10.56PYY78 pKa = 10.75RR79 pKa = 11.84DD80 pKa = 3.79LGEE83 pKa = 5.03PDD85 pKa = 3.59DD86 pKa = 3.89FCYY89 pKa = 10.4RR90 pKa = 11.84MASALTGDD98 pKa = 3.3VATFQKK104 pKa = 10.83AWDD107 pKa = 3.72TLYY110 pKa = 11.32ASGGGDD116 pKa = 3.36LPEE119 pKa = 4.43VQLQALIDD127 pKa = 3.98AAQDD131 pKa = 3.43PTVGWRR137 pKa = 11.84VIDD140 pKa = 4.08NSIQSGDD147 pKa = 3.78DD148 pKa = 3.32VSSVVGARR156 pKa = 11.84LIVLSTDD163 pKa = 3.72AVPHH167 pKa = 7.06DD168 pKa = 4.25PLDD171 pKa = 3.75YY172 pKa = 10.98DD173 pKa = 4.75LYY175 pKa = 11.25LEE177 pKa = 4.84EE178 pKa = 5.33PLPEE182 pKa = 4.81PPLPPSFMPPFPDD195 pKa = 2.9NSVGVTPDD203 pKa = 3.76FQCRR207 pKa = 11.84IYY209 pKa = 10.38DD210 pKa = 4.0YY211 pKa = 11.23PSMAQAANVLKK222 pKa = 9.32TNNVMVVFLVPEE234 pKa = 4.22IEE236 pKa = 4.12TDD238 pKa = 4.61AVAKK242 pKa = 9.69WSEE245 pKa = 4.08FNTEE249 pKa = 4.08YY250 pKa = 10.85LGQPANFLQYY260 pKa = 10.3ISSDD264 pKa = 3.11SSDD267 pKa = 2.71IVQVVLQAVSAVSQYY282 pKa = 11.22VCFF285 pKa = 4.38
MM1 pKa = 7.45KK2 pKa = 10.5CLGAFFASVVLVSGGLSTYY21 pKa = 11.01SDD23 pKa = 3.69TCFLPIDD30 pKa = 4.16LLLVQDD36 pKa = 3.99TTGSFMDD43 pKa = 4.84DD44 pKa = 3.5LPNVSKK50 pKa = 10.99AIPTLVSSVLEE61 pKa = 4.21NNPGSHH67 pKa = 6.84FGAVEE72 pKa = 4.43FKK74 pKa = 10.71DD75 pKa = 3.51KK76 pKa = 10.56PYY78 pKa = 10.75RR79 pKa = 11.84DD80 pKa = 3.79LGEE83 pKa = 5.03PDD85 pKa = 3.59DD86 pKa = 3.89FCYY89 pKa = 10.4RR90 pKa = 11.84MASALTGDD98 pKa = 3.3VATFQKK104 pKa = 10.83AWDD107 pKa = 3.72TLYY110 pKa = 11.32ASGGGDD116 pKa = 3.36LPEE119 pKa = 4.43VQLQALIDD127 pKa = 3.98AAQDD131 pKa = 3.43PTVGWRR137 pKa = 11.84VIDD140 pKa = 4.08NSIQSGDD147 pKa = 3.78DD148 pKa = 3.32VSSVVGARR156 pKa = 11.84LIVLSTDD163 pKa = 3.72AVPHH167 pKa = 7.06DD168 pKa = 4.25PLDD171 pKa = 3.75YY172 pKa = 10.98DD173 pKa = 4.75LYY175 pKa = 11.25LEE177 pKa = 4.84EE178 pKa = 5.33PLPEE182 pKa = 4.81PPLPPSFMPPFPDD195 pKa = 2.9NSVGVTPDD203 pKa = 3.76FQCRR207 pKa = 11.84IYY209 pKa = 10.38DD210 pKa = 4.0YY211 pKa = 11.23PSMAQAANVLKK222 pKa = 9.32TNNVMVVFLVPEE234 pKa = 4.22IEE236 pKa = 4.12TDD238 pKa = 4.61AVAKK242 pKa = 9.69WSEE245 pKa = 4.08FNTEE249 pKa = 4.08YY250 pKa = 10.85LGQPANFLQYY260 pKa = 10.3ISSDD264 pKa = 3.11SSDD267 pKa = 2.71IVQVVLQAVSAVSQYY282 pKa = 11.22VCFF285 pKa = 4.38
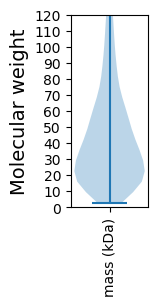
Molecular weight: 30.93 kDa
Isoelectric point according different methods:
Protein with the highest isoelectric point:
>tr|A0A023BA32|A0A023BA32_GRENI C2 domain-containing protein OS=Gregarina niphandrodes OX=110365 GN=GNI_042550 PE=4 SV=1
KKK2 pKa = 10.1ATLQGLAHHH11 pKa = 6.63ALCKKK16 pKa = 6.11HHH18 pKa = 7.17KK19 pKa = 10.43LRR21 pKa = 11.84QNAAHHH27 pKa = 6.87PVVPIPHHH35 pKa = 7.38SRR37 pKa = 11.84RR38 pKa = 11.84PPTLPGPRR46 pKa = 11.84RR47 pKa = 11.84RR48 pKa = 11.84ALLHHH53 pKa = 6.22PQMPIHHH60 pKa = 6.15HH61 pKa = 6.54VFPSPHHH68 pKa = 6.44LRR70 pKa = 11.84FRR72 pKa = 11.84LRR74 pKa = 11.84FASHHH79 pKa = 6.99LRR81 pKa = 11.84FRR83 pKa = 11.84LRR85 pKa = 11.84FASHHH90 pKa = 6.87FRR92 pKa = 11.84FRR94 pKa = 11.84LQFASRR100 pKa = 11.84FGHHH104 pKa = 5.19RR105 pKa = 11.84
KKK2 pKa = 10.1ATLQGLAHHH11 pKa = 6.63ALCKKK16 pKa = 6.11HHH18 pKa = 7.17KK19 pKa = 10.43LRR21 pKa = 11.84QNAAHHH27 pKa = 6.87PVVPIPHHH35 pKa = 7.38SRR37 pKa = 11.84RR38 pKa = 11.84PPTLPGPRR46 pKa = 11.84RR47 pKa = 11.84RR48 pKa = 11.84ALLHHH53 pKa = 6.22PQMPIHHH60 pKa = 6.15HH61 pKa = 6.54VFPSPHHH68 pKa = 6.44LRR70 pKa = 11.84FRR72 pKa = 11.84LRR74 pKa = 11.84FASHHH79 pKa = 6.99LRR81 pKa = 11.84FRR83 pKa = 11.84LRR85 pKa = 11.84FASHHH90 pKa = 6.87FRR92 pKa = 11.84FRR94 pKa = 11.84LQFASRR100 pKa = 11.84FGHHH104 pKa = 5.19RR105 pKa = 11.84
Molecular weight: 12.49 kDa
Isoelectric point according different methods:
Peptides (in silico digests for buttom-up proteomics)
Below you can find in silico digests of the whole proteome with Trypsin, Chymotrypsin, Trypsin+LysC, LysN, ArgC proteases suitable for different mass spec machines.| Try ESI |
 |
|---|
| ChTry ESI |
 |
|---|
| ArgC ESI |
 |
|---|
| LysN ESI |
 |
|---|
| TryLysC ESI |
 |
|---|
| Try MALDI |
 |
|---|
| ChTry MALDI |
 |
|---|
| ArgC MALDI |
 |
|---|
| LysN MALDI |
 |
|---|
| TryLysC MALDI |
 |
|---|
| Try LTQ |
 |
|---|
| ChTry LTQ |
 |
|---|
| ArgC LTQ |
 |
|---|
| LysN LTQ |
 |
|---|
| TryLysC LTQ |
 |
|---|
| Try MSlow |
 |
|---|
| ChTry MSlow |
 |
|---|
| ArgC MSlow |
 |
|---|
| LysN MSlow |
 |
|---|
| TryLysC MSlow |
 |
|---|
| Try MShigh |
 |
|---|
| ChTry MShigh |
 |
|---|
| ArgC MShigh |
 |
|---|
| LysN MShigh |
 |
|---|
| TryLysC MShigh |
 |
|---|
General Statistics
Number of major isoforms |
Number of additional isoforms |
Number of all proteins |
Number of amino acids |
Min. Seq. Length |
Max. Seq. Length |
Avg. Seq. Length |
Avg. Mol. Weight |
|---|---|---|---|---|---|---|---|
0 |
2913775 |
23 |
5952 |
459.5 |
50.77 |
Amino acid frequency
Ala |
Cys |
Asp |
Glu |
Phe |
Gly |
His |
Ile |
Lys |
Leu |
|---|---|---|---|---|---|---|---|---|---|
8.541 ± 0.035 | 1.927 ± 0.015 |
5.773 ± 0.022 | 6.571 ± 0.03 |
3.196 ± 0.016 | 7.034 ± 0.033 |
2.319 ± 0.012 | 4.067 ± 0.026 |
4.657 ± 0.029 | 9.476 ± 0.036 |
Met |
Asn |
Gln |
Pro |
Arg |
Ser |
Thr |
Val |
Trp |
Tyr |
|---|---|---|---|---|---|---|---|---|---|
2.071 ± 0.012 | 3.416 ± 0.02 |
5.748 ± 0.032 | 4.017 ± 0.02 |
6.567 ± 0.026 | 7.697 ± 0.031 |
5.978 ± 0.025 | 6.966 ± 0.022 |
1.382 ± 0.011 | 2.595 ± 0.019 |
Most of the basic statistics you can see at this page can be downloaded from this CSV file
Proteome-pI is available under Creative Commons Attribution-NoDerivs license, for more details see here
| Reference: Kozlowski LP. Proteome-pI 2.0: Proteome Isoelectric Point Database Update. Nucleic Acids Res. 2021, doi: 10.1093/nar/gkab944 | Contact: Lukasz P. Kozlowski |
