Vibrio phage CKB-S2
Taxonomy: Viruses; Duplodnaviria; Heunggongvirae; Uroviricota; Caudoviricetes; Caudovirales; Podoviridae; unclassified Podoviridae
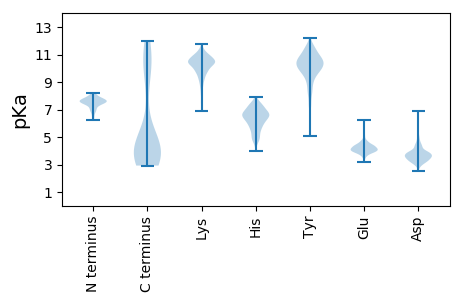
Average proteome isoelectric point is 6.55
Get precalculated fractions of proteins

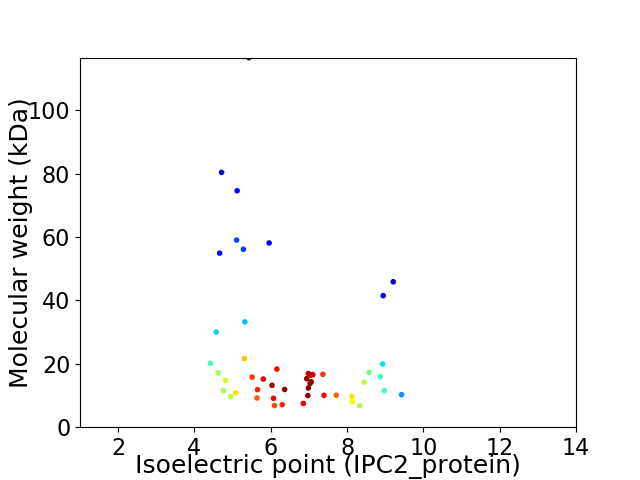
Virtual 2D-PAGE plot for 49 proteins (isoelectric point calculated using IPC2_protein)
Get csv file with sequences according to given criteria:
* You can choose from 21 different methods for calculating isoelectric point
Summary statistics related to proteome-wise predictions


Protein with the lowest isoelectric point:
>tr|A0A1E1GEA8|A0A1E1GEA8_9CAUD Uncharacterized protein OS=Vibrio phage CKB-S2 OX=1903260 PE=4 SV=1
MM1 pKa = 6.89TKK3 pKa = 10.85SMFHH7 pKa = 6.82LLLTLFLSVFFAFMNATKK25 pKa = 10.58ALASEE30 pKa = 4.66EE31 pKa = 3.95EE32 pKa = 4.31TTAVFVGGWSYY43 pKa = 11.5HH44 pKa = 5.81FDD46 pKa = 3.29QEE48 pKa = 3.77YY49 pKa = 10.49DD50 pKa = 3.79YY51 pKa = 11.5NEE53 pKa = 4.03SHH55 pKa = 7.08AMFAFQYY62 pKa = 9.9DD63 pKa = 3.83KK64 pKa = 11.41VVAGTFINSYY74 pKa = 9.24SDD76 pKa = 2.83RR77 pKa = 11.84GYY79 pKa = 11.62LLGYY83 pKa = 10.14DD84 pKa = 3.02SWKK87 pKa = 10.44IEE89 pKa = 4.03NEE91 pKa = 3.71YY92 pKa = 10.75GAIGTYY98 pKa = 7.68ITLMTGYY105 pKa = 10.39EE106 pKa = 4.15NFRR109 pKa = 11.84VLPMILPYY117 pKa = 10.63AQLNAFEE124 pKa = 4.69VNDD127 pKa = 3.78IEE129 pKa = 4.85IKK131 pKa = 9.36PTVLLWGKK139 pKa = 10.1AVALTINVEE148 pKa = 4.2FF149 pKa = 4.78
MM1 pKa = 6.89TKK3 pKa = 10.85SMFHH7 pKa = 6.82LLLTLFLSVFFAFMNATKK25 pKa = 10.58ALASEE30 pKa = 4.66EE31 pKa = 3.95EE32 pKa = 4.31TTAVFVGGWSYY43 pKa = 11.5HH44 pKa = 5.81FDD46 pKa = 3.29QEE48 pKa = 3.77YY49 pKa = 10.49DD50 pKa = 3.79YY51 pKa = 11.5NEE53 pKa = 4.03SHH55 pKa = 7.08AMFAFQYY62 pKa = 9.9DD63 pKa = 3.83KK64 pKa = 11.41VVAGTFINSYY74 pKa = 9.24SDD76 pKa = 2.83RR77 pKa = 11.84GYY79 pKa = 11.62LLGYY83 pKa = 10.14DD84 pKa = 3.02SWKK87 pKa = 10.44IEE89 pKa = 4.03NEE91 pKa = 3.71YY92 pKa = 10.75GAIGTYY98 pKa = 7.68ITLMTGYY105 pKa = 10.39EE106 pKa = 4.15NFRR109 pKa = 11.84VLPMILPYY117 pKa = 10.63AQLNAFEE124 pKa = 4.69VNDD127 pKa = 3.78IEE129 pKa = 4.85IKK131 pKa = 9.36PTVLLWGKK139 pKa = 10.1AVALTINVEE148 pKa = 4.2FF149 pKa = 4.78
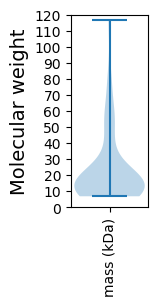
Molecular weight: 17.1 kDa
Isoelectric point according different methods:
Protein with the highest isoelectric point:
>tr|A0A1E1GE66|A0A1E1GE66_9CAUD Uncharacterized protein OS=Vibrio phage CKB-S2 OX=1903260 PE=4 SV=1
MM1 pKa = 7.6GNLPQYY7 pKa = 8.75CHH9 pKa = 6.23KK10 pKa = 10.23HH11 pKa = 4.84DD12 pKa = 4.6RR13 pKa = 11.84EE14 pKa = 4.46WIRR17 pKa = 11.84QQLGKK22 pKa = 10.44LPHH25 pKa = 6.33HH26 pKa = 6.69WRR28 pKa = 11.84EE29 pKa = 4.01QVAKK33 pKa = 10.46VYY35 pKa = 10.38SDD37 pKa = 3.35KK38 pKa = 11.35YY39 pKa = 10.15KK40 pKa = 9.85EE41 pKa = 3.96IYY43 pKa = 9.91YY44 pKa = 10.02SEE46 pKa = 4.64HH47 pKa = 6.84EE48 pKa = 4.48SPKK51 pKa = 10.07SEE53 pKa = 3.51NRR55 pKa = 11.84ARR57 pKa = 11.84NAANAWLRR65 pKa = 11.84GYY67 pKa = 7.04VTKK70 pKa = 10.91YY71 pKa = 9.96INRR74 pKa = 11.84KK75 pKa = 7.48FSKK78 pKa = 10.96VNVKK82 pKa = 10.5HH83 pKa = 5.71NN84 pKa = 3.58
MM1 pKa = 7.6GNLPQYY7 pKa = 8.75CHH9 pKa = 6.23KK10 pKa = 10.23HH11 pKa = 4.84DD12 pKa = 4.6RR13 pKa = 11.84EE14 pKa = 4.46WIRR17 pKa = 11.84QQLGKK22 pKa = 10.44LPHH25 pKa = 6.33HH26 pKa = 6.69WRR28 pKa = 11.84EE29 pKa = 4.01QVAKK33 pKa = 10.46VYY35 pKa = 10.38SDD37 pKa = 3.35KK38 pKa = 11.35YY39 pKa = 10.15KK40 pKa = 9.85EE41 pKa = 3.96IYY43 pKa = 9.91YY44 pKa = 10.02SEE46 pKa = 4.64HH47 pKa = 6.84EE48 pKa = 4.48SPKK51 pKa = 10.07SEE53 pKa = 3.51NRR55 pKa = 11.84ARR57 pKa = 11.84NAANAWLRR65 pKa = 11.84GYY67 pKa = 7.04VTKK70 pKa = 10.91YY71 pKa = 9.96INRR74 pKa = 11.84KK75 pKa = 7.48FSKK78 pKa = 10.96VNVKK82 pKa = 10.5HH83 pKa = 5.71NN84 pKa = 3.58
Molecular weight: 10.26 kDa
Isoelectric point according different methods:
Peptides (in silico digests for buttom-up proteomics)
Below you can find in silico digests of the whole proteome with Trypsin, Chymotrypsin, Trypsin+LysC, LysN, ArgC proteases suitable for different mass spec machines.| Try ESI |
 |
|---|
| ChTry ESI |
 |
|---|
| ArgC ESI |
 |
|---|
| LysN ESI |
 |
|---|
| TryLysC ESI |
 |
|---|
| Try MALDI |
 |
|---|
| ChTry MALDI |
 |
|---|
| ArgC MALDI |
 |
|---|
| LysN MALDI |
 |
|---|
| TryLysC MALDI |
 |
|---|
| Try LTQ |
 |
|---|
| ChTry LTQ |
 |
|---|
| ArgC LTQ |
 |
|---|
| LysN LTQ |
 |
|---|
| TryLysC LTQ |
 |
|---|
| Try MSlow |
 |
|---|
| ChTry MSlow |
 |
|---|
| ArgC MSlow |
 |
|---|
| LysN MSlow |
 |
|---|
| TryLysC MSlow |
 |
|---|
| Try MShigh |
 |
|---|
| ChTry MShigh |
 |
|---|
| ArgC MShigh |
 |
|---|
| LysN MShigh |
 |
|---|
| TryLysC MShigh |
 |
|---|
General Statistics
Number of major isoforms |
Number of additional isoforms |
Number of all proteins |
Number of amino acids |
Min. Seq. Length |
Max. Seq. Length |
Avg. Seq. Length |
Avg. Mol. Weight |
|---|---|---|---|---|---|---|---|
0 |
10273 |
58 |
1059 |
209.7 |
23.43 |
Amino acid frequency
Ala |
Cys |
Asp |
Glu |
Phe |
Gly |
His |
Ile |
Lys |
Leu |
|---|---|---|---|---|---|---|---|---|---|
9.355 ± 0.632 | 0.818 ± 0.191 |
6.084 ± 0.325 | 6.999 ± 0.341 |
3.534 ± 0.231 | 7.369 ± 0.383 |
1.84 ± 0.232 | 5.5 ± 0.186 |
6.979 ± 0.348 | 7.651 ± 0.329 |
Met |
Asn |
Gln |
Pro |
Arg |
Ser |
Thr |
Val |
Trp |
Tyr |
|---|---|---|---|---|---|---|---|---|---|
2.93 ± 0.231 | 4.994 ± 0.332 |
3.631 ± 0.191 | 4.906 ± 0.392 |
5.14 ± 0.324 | 5.48 ± 0.28 |
5.675 ± 0.284 | 6.23 ± 0.343 |
1.441 ± 0.106 | 3.446 ± 0.19 |
Most of the basic statistics you can see at this page can be downloaded from this CSV file
Proteome-pI is available under Creative Commons Attribution-NoDerivs license, for more details see here
| Reference: Kozlowski LP. Proteome-pI 2.0: Proteome Isoelectric Point Database Update. Nucleic Acids Res. 2021, doi: 10.1093/nar/gkab944 | Contact: Lukasz P. Kozlowski |
