Microbacterium phage BubbaBear
Taxonomy: Viruses; Duplodnaviria; Heunggongvirae; Uroviricota; Caudoviricetes; Caudovirales; Siphoviridae; Dismasvirus; unclassified Dismasvirus
Average proteome isoelectric point is 6.22
Get precalculated fractions of proteins
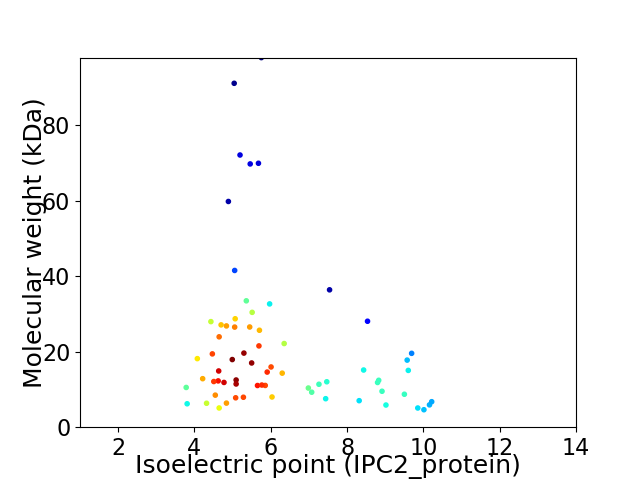
Virtual 2D-PAGE plot for 68 proteins (isoelectric point calculated using IPC2_protein)
Get csv file with sequences according to given criteria:
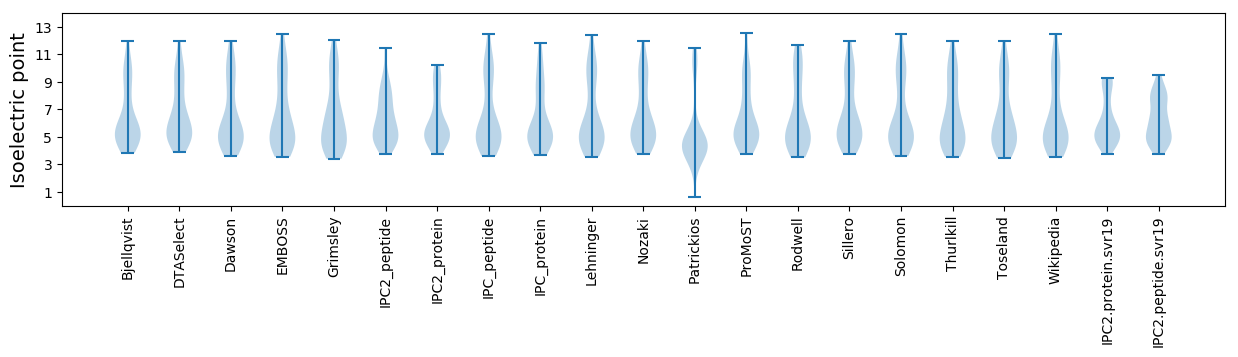
* You can choose from 21 different methods for calculating isoelectric point
Summary statistics related to proteome-wise predictions
Protein with the lowest isoelectric point:
>tr|A0A4D6T5L7|A0A4D6T5L7_9CAUD Minor tail protein OS=Microbacterium phage BubbaBear OX=2572529 GN=17 PE=4 SV=1
MM1 pKa = 7.79ADD3 pKa = 3.6EE4 pKa = 4.77EE5 pKa = 4.57LTPILWDD12 pKa = 3.36ATCRR16 pKa = 11.84TDD18 pKa = 2.9GCEE21 pKa = 3.8NADD24 pKa = 3.07ITFRR28 pKa = 11.84VPAHH32 pKa = 7.21PEE34 pKa = 3.59TPMILCGPCGTLITDD49 pKa = 4.4LTPSPEE55 pKa = 3.84GDD57 pKa = 3.01AA58 pKa = 4.77
MM1 pKa = 7.79ADD3 pKa = 3.6EE4 pKa = 4.77EE5 pKa = 4.57LTPILWDD12 pKa = 3.36ATCRR16 pKa = 11.84TDD18 pKa = 2.9GCEE21 pKa = 3.8NADD24 pKa = 3.07ITFRR28 pKa = 11.84VPAHH32 pKa = 7.21PEE34 pKa = 3.59TPMILCGPCGTLITDD49 pKa = 4.4LTPSPEE55 pKa = 3.84GDD57 pKa = 3.01AA58 pKa = 4.77
Molecular weight: 6.2 kDa
Isoelectric point according different methods:
Protein with the highest isoelectric point:
>tr|A0A4D6T6Z8|A0A4D6T6Z8_9CAUD Uncharacterized protein OS=Microbacterium phage BubbaBear OX=2572529 GN=42 PE=4 SV=1
MM1 pKa = 6.71THH3 pKa = 6.21PVVYY7 pKa = 9.97LVEE10 pKa = 4.58GADD13 pKa = 3.96GTGKK17 pKa = 9.02TSFVKK22 pKa = 10.79SMVSIHH28 pKa = 6.22AQLGDD33 pKa = 3.42RR34 pKa = 11.84EE35 pKa = 4.23PRR37 pKa = 11.84VIHH40 pKa = 6.8NDD42 pKa = 3.2ASDD45 pKa = 3.41HH46 pKa = 6.12KK47 pKa = 11.07LPGSLYY53 pKa = 8.85RR54 pKa = 11.84HH55 pKa = 5.92YY56 pKa = 10.58RR57 pKa = 11.84AQLLDD62 pKa = 5.06AIDD65 pKa = 3.99FRR67 pKa = 11.84DD68 pKa = 3.37NHH70 pKa = 6.7GISTYY75 pKa = 9.84IDD77 pKa = 3.14RR78 pKa = 11.84SFLSEE83 pKa = 4.2LVYY86 pKa = 11.11GPLYY90 pKa = 9.99RR91 pKa = 11.84SKK93 pKa = 11.16SRR95 pKa = 11.84ITRR98 pKa = 11.84RR99 pKa = 11.84QARR102 pKa = 11.84RR103 pKa = 11.84LEE105 pKa = 4.17RR106 pKa = 11.84LADD109 pKa = 3.48RR110 pKa = 11.84HH111 pKa = 6.22GIVLLGMTADD121 pKa = 3.59LNLRR125 pKa = 11.84RR126 pKa = 11.84LRR128 pKa = 11.84IRR130 pKa = 11.84ARR132 pKa = 11.84GEE134 pKa = 3.35TWTRR138 pKa = 11.84KK139 pKa = 9.61DD140 pKa = 3.3AFVGALYY147 pKa = 10.12SQHH150 pKa = 5.03FRR152 pKa = 11.84EE153 pKa = 4.63RR154 pKa = 11.84GRR156 pKa = 11.84YY157 pKa = 7.86WLTADD162 pKa = 3.59SSSATVLNN170 pKa = 4.16
MM1 pKa = 6.71THH3 pKa = 6.21PVVYY7 pKa = 9.97LVEE10 pKa = 4.58GADD13 pKa = 3.96GTGKK17 pKa = 9.02TSFVKK22 pKa = 10.79SMVSIHH28 pKa = 6.22AQLGDD33 pKa = 3.42RR34 pKa = 11.84EE35 pKa = 4.23PRR37 pKa = 11.84VIHH40 pKa = 6.8NDD42 pKa = 3.2ASDD45 pKa = 3.41HH46 pKa = 6.12KK47 pKa = 11.07LPGSLYY53 pKa = 8.85RR54 pKa = 11.84HH55 pKa = 5.92YY56 pKa = 10.58RR57 pKa = 11.84AQLLDD62 pKa = 5.06AIDD65 pKa = 3.99FRR67 pKa = 11.84DD68 pKa = 3.37NHH70 pKa = 6.7GISTYY75 pKa = 9.84IDD77 pKa = 3.14RR78 pKa = 11.84SFLSEE83 pKa = 4.2LVYY86 pKa = 11.11GPLYY90 pKa = 9.99RR91 pKa = 11.84SKK93 pKa = 11.16SRR95 pKa = 11.84ITRR98 pKa = 11.84RR99 pKa = 11.84QARR102 pKa = 11.84RR103 pKa = 11.84LEE105 pKa = 4.17RR106 pKa = 11.84LADD109 pKa = 3.48RR110 pKa = 11.84HH111 pKa = 6.22GIVLLGMTADD121 pKa = 3.59LNLRR125 pKa = 11.84RR126 pKa = 11.84LRR128 pKa = 11.84IRR130 pKa = 11.84ARR132 pKa = 11.84GEE134 pKa = 3.35TWTRR138 pKa = 11.84KK139 pKa = 9.61DD140 pKa = 3.3AFVGALYY147 pKa = 10.12SQHH150 pKa = 5.03FRR152 pKa = 11.84EE153 pKa = 4.63RR154 pKa = 11.84GRR156 pKa = 11.84YY157 pKa = 7.86WLTADD162 pKa = 3.59SSSATVLNN170 pKa = 4.16
Molecular weight: 19.55 kDa
Isoelectric point according different methods:
Peptides (in silico digests for buttom-up proteomics)
Below you can find in silico digests of the whole proteome with Trypsin, Chymotrypsin, Trypsin+LysC, LysN, ArgC proteases suitable for different mass spec machines.| Try ESI |
 |
|---|
| ChTry ESI |
|
|---|
| ArgC ESI |
|
|---|
| LysN ESI |
|
|---|
| TryLysC ESI |
|
|---|
| Try MALDI |
|
|---|
| ChTry MALDI |
|
|---|
| ArgC MALDI |
|
|---|
| LysN MALDI |
|
|---|
| TryLysC MALDI |
|
|---|
| Try LTQ |
|
|---|
| ChTry LTQ |
|
|---|
| ArgC LTQ |
|
|---|
| LysN LTQ |
|
|---|
| TryLysC LTQ |
|
|---|
| Try MSlow |
|
|---|
| ChTry MSlow |
|
|---|
| ArgC MSlow |
|
|---|
| LysN MSlow |
|
|---|
| TryLysC MSlow |
|
|---|
| Try MShigh |
|
|---|
| ChTry MShigh |
|
|---|
| ArgC MShigh |
|
|---|
| LysN MShigh |
|
|---|
| TryLysC MShigh |
|
|---|
General Statistics
Number of major isoforms |
Number of additional isoforms |
Number of all proteins |
Number of amino acids |
Min. Seq. Length |
Max. Seq. Length |
Avg. Seq. Length |
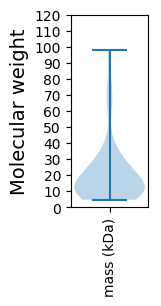
Avg. Mol. Weight |
|---|---|---|---|---|---|---|---|
0 |
13168 |
42 |
920 |
193.6 |
21.18 |
Amino acid frequency
Ala |
Cys |
Asp |
Glu |
Phe |
Gly |
His |
Ile |
Lys |
Leu |
|---|---|---|---|---|---|---|---|---|---|
11.703 ± 0.327 | 0.463 ± 0.11 |
6.607 ± 0.333 | 5.984 ± 0.277 |
3.212 ± 0.17 | 8.095 ± 0.328 |
1.876 ± 0.188 | 4.655 ± 0.225 |
4.215 ± 0.271 | 8.635 ± 0.282 |
Met |
Asn |
Gln |
Pro |
Arg |
Ser |
Thr |
Val |
Trp |
Tyr |
|---|---|---|---|---|---|---|---|---|---|
2.195 ± 0.135 | 3.395 ± 0.227 |
5.308 ± 0.212 | 3.311 ± 0.153 |
6.372 ± 0.356 | 5.331 ± 0.278 |
6.797 ± 0.453 | 7.268 ± 0.308 |
2.119 ± 0.14 | 2.461 ± 0.152 |
Most of the basic statistics you can see at this page can be downloaded from this CSV file
See this proteome in:

Proteome-pI is available under Creative Commons Attribution-NoDerivs license, for more details see here
| Reference: Kozlowski LP. Proteome-pI 2.0: Proteome Isoelectric Point Database Update. Nucleic Acids Res. 2021, doi: 10.1093/nar/gkab944 | Contact: Lukasz P. Kozlowski |