Escherichia phage vB_EcoS-2004IV
Taxonomy: Viruses; Duplodnaviria; Heunggongvirae; Uroviricota; Caudoviricetes; Caudovirales; Drexlerviridae; Braunvirinae; Veterinaerplatzvirus; unclassified Veterinaerplatzvirus
Average proteome isoelectric point is 6.37
Get precalculated fractions of proteins
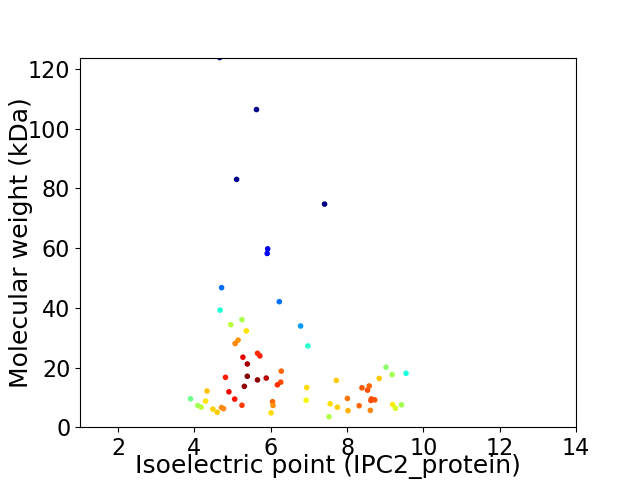
Virtual 2D-PAGE plot for 66 proteins (isoelectric point calculated using IPC2_protein)
Get csv file with sequences according to given criteria:
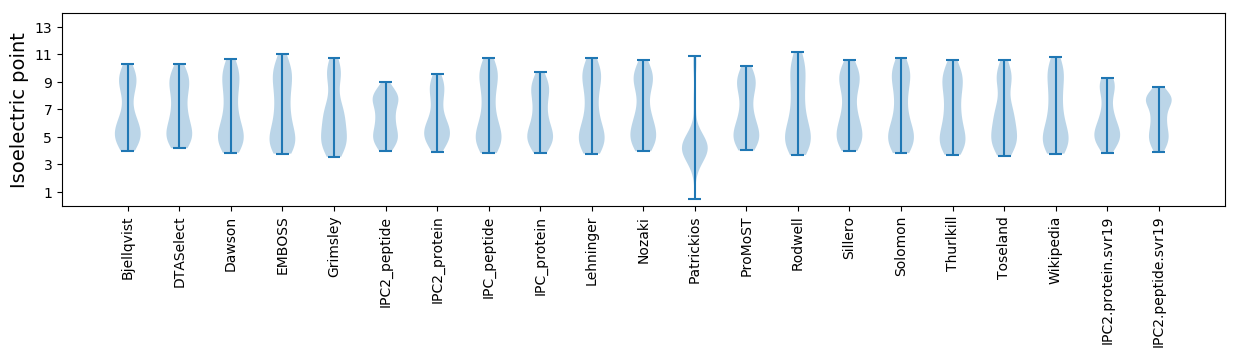
* You can choose from 21 different methods for calculating isoelectric point
Summary statistics related to proteome-wise predictions
Protein with the lowest isoelectric point:
>tr|A0A5P1M3R8|A0A5P1M3R8_9CAUD Uncharacterized protein OS=Escherichia phage vB_EcoS-2004IV OX=2576488 GN=AOGNBOCH_00025 PE=4 SV=1
MM1 pKa = 6.98ATIYY5 pKa = 8.92TGKK8 pKa = 9.49MYY10 pKa = 10.47EE11 pKa = 4.12SRR13 pKa = 11.84KK14 pKa = 8.17TGYY17 pKa = 10.07EE18 pKa = 3.89YY19 pKa = 11.09EE20 pKa = 4.22LVITADD26 pKa = 4.31GYY28 pKa = 11.83VLDD31 pKa = 5.88DD32 pKa = 3.87GDD34 pKa = 4.32GYY36 pKa = 11.51AFEE39 pKa = 4.81VSPTYY44 pKa = 10.73KK45 pKa = 10.51DD46 pKa = 3.65DD47 pKa = 4.74LEE49 pKa = 4.56TVKK52 pKa = 10.87NAFGEE57 pKa = 4.31KK58 pKa = 9.32FDD60 pKa = 4.45EE61 pKa = 4.48VSEE64 pKa = 4.18
MM1 pKa = 6.98ATIYY5 pKa = 8.92TGKK8 pKa = 9.49MYY10 pKa = 10.47EE11 pKa = 4.12SRR13 pKa = 11.84KK14 pKa = 8.17TGYY17 pKa = 10.07EE18 pKa = 3.89YY19 pKa = 11.09EE20 pKa = 4.22LVITADD26 pKa = 4.31GYY28 pKa = 11.83VLDD31 pKa = 5.88DD32 pKa = 3.87GDD34 pKa = 4.32GYY36 pKa = 11.51AFEE39 pKa = 4.81VSPTYY44 pKa = 10.73KK45 pKa = 10.51DD46 pKa = 3.65DD47 pKa = 4.74LEE49 pKa = 4.56TVKK52 pKa = 10.87NAFGEE57 pKa = 4.31KK58 pKa = 9.32FDD60 pKa = 4.45EE61 pKa = 4.48VSEE64 pKa = 4.18
Molecular weight: 7.27 kDa
Isoelectric point according different methods:
Protein with the highest isoelectric point:
>tr|A0A5P1M2Z3|A0A5P1M2Z3_9CAUD Uncharacterized protein OS=Escherichia phage vB_EcoS-2004IV OX=2576488 GN=AOGNBOCH_00008 PE=4 SV=1
MM1 pKa = 7.18NAVDD5 pKa = 4.57KK6 pKa = 10.67RR7 pKa = 11.84TINGNNGTIRR17 pKa = 11.84TEE19 pKa = 4.03DD20 pKa = 2.82KK21 pKa = 10.5KK22 pKa = 10.72QRR24 pKa = 11.84KK25 pKa = 8.53RR26 pKa = 11.84PSGYY30 pKa = 10.06YY31 pKa = 8.95VLKK34 pKa = 10.9DD35 pKa = 3.51EE36 pKa = 4.52VRR38 pKa = 11.84AGLRR42 pKa = 11.84ARR44 pKa = 11.84LEE46 pKa = 3.84IVLDD50 pKa = 3.88FFGTKK55 pKa = 10.5ANMAKK60 pKa = 9.47QLKK63 pKa = 7.74VTPQAVEE70 pKa = 3.72EE71 pKa = 4.25WFKK74 pKa = 11.3RR75 pKa = 11.84GMMSARR81 pKa = 11.84GAQLSHH87 pKa = 6.72NYY89 pKa = 9.66YY90 pKa = 10.0KK91 pKa = 10.9RR92 pKa = 11.84NGEE95 pKa = 3.9GFRR98 pKa = 11.84ATFCRR103 pKa = 11.84PDD105 pKa = 3.38LQFDD109 pKa = 4.36GNGKK113 pKa = 8.92PLTLRR118 pKa = 11.84CKK120 pKa = 9.49KK121 pKa = 9.98RR122 pKa = 11.84HH123 pKa = 4.86MLRR126 pKa = 11.84VVTEE130 pKa = 4.33AEE132 pKa = 4.14LATKK136 pKa = 9.16PEE138 pKa = 4.04CRR140 pKa = 11.84SWRR143 pKa = 11.84KK144 pKa = 9.4IKK146 pKa = 10.36AANEE150 pKa = 3.74AARR153 pKa = 11.84KK154 pKa = 9.56AKK156 pKa = 9.88EE157 pKa = 3.61
MM1 pKa = 7.18NAVDD5 pKa = 4.57KK6 pKa = 10.67RR7 pKa = 11.84TINGNNGTIRR17 pKa = 11.84TEE19 pKa = 4.03DD20 pKa = 2.82KK21 pKa = 10.5KK22 pKa = 10.72QRR24 pKa = 11.84KK25 pKa = 8.53RR26 pKa = 11.84PSGYY30 pKa = 10.06YY31 pKa = 8.95VLKK34 pKa = 10.9DD35 pKa = 3.51EE36 pKa = 4.52VRR38 pKa = 11.84AGLRR42 pKa = 11.84ARR44 pKa = 11.84LEE46 pKa = 3.84IVLDD50 pKa = 3.88FFGTKK55 pKa = 10.5ANMAKK60 pKa = 9.47QLKK63 pKa = 7.74VTPQAVEE70 pKa = 3.72EE71 pKa = 4.25WFKK74 pKa = 11.3RR75 pKa = 11.84GMMSARR81 pKa = 11.84GAQLSHH87 pKa = 6.72NYY89 pKa = 9.66YY90 pKa = 10.0KK91 pKa = 10.9RR92 pKa = 11.84NGEE95 pKa = 3.9GFRR98 pKa = 11.84ATFCRR103 pKa = 11.84PDD105 pKa = 3.38LQFDD109 pKa = 4.36GNGKK113 pKa = 8.92PLTLRR118 pKa = 11.84CKK120 pKa = 9.49KK121 pKa = 9.98RR122 pKa = 11.84HH123 pKa = 4.86MLRR126 pKa = 11.84VVTEE130 pKa = 4.33AEE132 pKa = 4.14LATKK136 pKa = 9.16PEE138 pKa = 4.04CRR140 pKa = 11.84SWRR143 pKa = 11.84KK144 pKa = 9.4IKK146 pKa = 10.36AANEE150 pKa = 3.74AARR153 pKa = 11.84KK154 pKa = 9.56AKK156 pKa = 9.88EE157 pKa = 3.61
Molecular weight: 18.06 kDa
Isoelectric point according different methods:
Peptides (in silico digests for buttom-up proteomics)
Below you can find in silico digests of the whole proteome with Trypsin, Chymotrypsin, Trypsin+LysC, LysN, ArgC proteases suitable for different mass spec machines.| Try ESI |
 |
|---|
| ChTry ESI |
|
|---|
| ArgC ESI |
|
|---|
| LysN ESI |
|
|---|
| TryLysC ESI |
|
|---|
| Try MALDI |
|
|---|
| ChTry MALDI |
|
|---|
| ArgC MALDI |
|
|---|
| LysN MALDI |
|
|---|
| TryLysC MALDI |
|
|---|
| Try LTQ |
|
|---|
| ChTry LTQ |
|
|---|
| ArgC LTQ |
|
|---|
| LysN LTQ |
|
|---|
| TryLysC LTQ |
|
|---|
| Try MSlow |
|
|---|
| ChTry MSlow |
|
|---|
| ArgC MSlow |
|
|---|
| LysN MSlow |
|
|---|
| TryLysC MSlow |
|
|---|
| Try MShigh |
|
|---|
| ChTry MShigh |
|
|---|
| ArgC MShigh |
|
|---|
| LysN MShigh |
|
|---|
| TryLysC MShigh |
|
|---|
General Statistics
Number of major isoforms |
Number of additional isoforms |
Number of all proteins |
Number of amino acids |
Min. Seq. Length |
Max. Seq. Length |
Avg. Seq. Length |
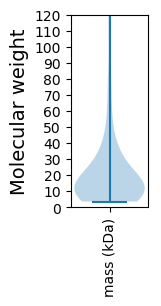
Avg. Mol. Weight |
|---|---|---|---|---|---|---|---|
0 |
12965 |
30 |
1123 |
196.4 |
21.79 |
Amino acid frequency
Ala |
Cys |
Asp |
Glu |
Phe |
Gly |
His |
Ile |
Lys |
Leu |
|---|---|---|---|---|---|---|---|---|---|
8.577 ± 0.56 | 1.226 ± 0.187 |
5.985 ± 0.25 | 6.656 ± 0.359 |
3.741 ± 0.179 | 7.536 ± 0.295 |
1.25 ± 0.202 | 7.042 ± 0.184 |
6.51 ± 0.344 | 7.096 ± 0.31 |
Met |
Asn |
Gln |
Pro |
Arg |
Ser |
Thr |
Val |
Trp |
Tyr |
|---|---|---|---|---|---|---|---|---|---|
2.53 ± 0.281 | 5.191 ± 0.288 |
3.062 ± 0.229 | 3.926 ± 0.398 |
4.975 ± 0.189 | 7.111 ± 0.415 |
5.646 ± 0.292 | 7.034 ± 0.337 |
1.111 ± 0.102 | 3.795 ± 0.206 |
Most of the basic statistics you can see at this page can be downloaded from this CSV file
See this proteome in:

Proteome-pI is available under Creative Commons Attribution-NoDerivs license, for more details see here
| Reference: Kozlowski LP. Proteome-pI 2.0: Proteome Isoelectric Point Database Update. Nucleic Acids Res. 2021, doi: 10.1093/nar/gkab944 | Contact: Lukasz P. Kozlowski |