Giant house spider associated circular virus 4
Taxonomy: Viruses; unclassified viruses; unclassified DNA viruses; unclassified ssDNA viruses
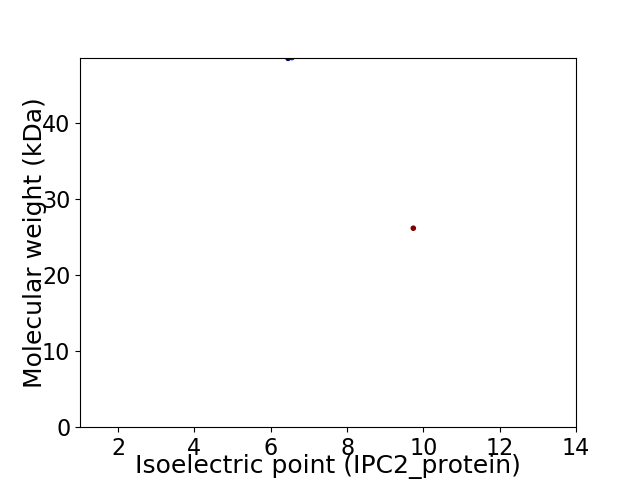
Average proteome isoelectric point is 7.9
Get precalculated fractions of proteins

Virtual 2D-PAGE plot for 2 proteins (isoelectric point calculated using IPC2_protein)
Get csv file with sequences according to given criteria:
* You can choose from 21 different methods for calculating isoelectric point
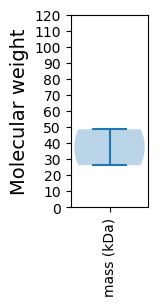
Summary statistics related to proteome-wise predictions


Protein with the lowest isoelectric point:
>tr|A0A346BPE6|A0A346BPE6_9VIRU Coat protein OS=Giant house spider associated circular virus 4 OX=2293291 PE=4 SV=1
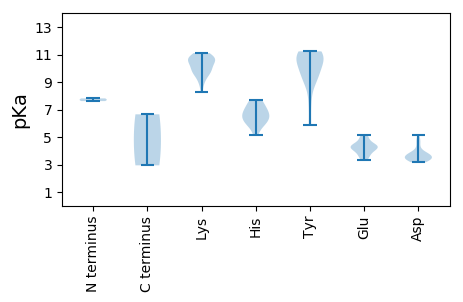
MM1 pKa = 7.61SFRR4 pKa = 11.84FNARR8 pKa = 11.84AVFLTYY14 pKa = 9.04PQCPLLKK21 pKa = 10.05QHH23 pKa = 6.15VLTMLRR29 pKa = 11.84TKK31 pKa = 10.65LGEE34 pKa = 4.35DD35 pKa = 3.4EE36 pKa = 4.28GTHH39 pKa = 5.17YY40 pKa = 11.19LIGQEE45 pKa = 4.09THH47 pKa = 7.17KK48 pKa = 11.11DD49 pKa = 3.74GTPHH53 pKa = 6.46LHH55 pKa = 6.05IFVEE59 pKa = 4.61RR60 pKa = 11.84GHH62 pKa = 7.38LINTRR67 pKa = 11.84NARR70 pKa = 11.84YY71 pKa = 9.21FDD73 pKa = 4.74LEE75 pKa = 4.32DD76 pKa = 3.71ASGIYY81 pKa = 9.34HH82 pKa = 6.95PNVTAPRR89 pKa = 11.84DD90 pKa = 3.42RR91 pKa = 11.84ADD93 pKa = 3.46VIRR96 pKa = 11.84YY97 pKa = 5.85ITKK100 pKa = 10.29EE101 pKa = 3.6DD102 pKa = 3.75TEE104 pKa = 4.29PVKK107 pKa = 10.55WPEE110 pKa = 3.35TWKK113 pKa = 10.6FDD115 pKa = 3.73EE116 pKa = 4.83PPKK119 pKa = 10.61KK120 pKa = 9.71RR121 pKa = 11.84SKK123 pKa = 10.04WEE125 pKa = 3.51QATPLLLEE133 pKa = 4.66GQDD136 pKa = 3.3AATLLKK142 pKa = 10.74SMPVFVLGNLKK153 pKa = 9.96KK154 pKa = 10.53VQEE157 pKa = 4.28ATAFLANIKK166 pKa = 9.27QQASLPPLEE175 pKa = 5.07TFLTWVLPAEE185 pKa = 4.38PEE187 pKa = 4.14YY188 pKa = 10.97EE189 pKa = 3.86RR190 pKa = 11.84NIAFKK195 pKa = 9.51TVWNEE200 pKa = 3.5LRR202 pKa = 11.84DD203 pKa = 3.91NLASKK208 pKa = 10.95DD209 pKa = 3.47FGRR212 pKa = 11.84RR213 pKa = 11.84QLYY216 pKa = 9.78LHH218 pKa = 6.95GPTGIGKK225 pKa = 8.25STFLRR230 pKa = 11.84HH231 pKa = 6.51LLMCIRR237 pKa = 11.84TYY239 pKa = 10.77ILPNEE244 pKa = 4.28DD245 pKa = 5.16WYY247 pKa = 10.75DD248 pKa = 3.17HH249 pKa = 6.59WDD251 pKa = 3.51NNLFDD256 pKa = 4.81LSVMEE261 pKa = 4.32EE262 pKa = 4.02FKK264 pKa = 10.89GQKK267 pKa = 9.61SIQWLNQWLDD277 pKa = 3.35EE278 pKa = 3.81AHH280 pKa = 6.79FYY282 pKa = 10.96VKK284 pKa = 10.42RR285 pKa = 11.84KK286 pKa = 9.61GVAGLLKK293 pKa = 9.78TNPIPTILISNFDD306 pKa = 3.77INSSDD311 pKa = 3.75VYY313 pKa = 11.23PNMQEE318 pKa = 4.06SVSIQTLRR326 pKa = 11.84RR327 pKa = 11.84RR328 pKa = 11.84LRR330 pKa = 11.84SLPVDD335 pKa = 3.81STCMHH340 pKa = 7.64LLTKK344 pKa = 10.49ALRR347 pKa = 11.84QFLSSIGASLPHH359 pKa = 6.36IQGDD363 pKa = 4.27VPQTPPLNAAQEE375 pKa = 4.38IVNPLWRR382 pKa = 11.84GPEE385 pKa = 3.92VTTVLPAPPVGGQTEE400 pKa = 4.48HH401 pKa = 5.95TCYY404 pKa = 10.08GQNGAPFRR412 pKa = 11.84DD413 pKa = 3.39EE414 pKa = 5.16CGPSTCNAWHH424 pKa = 6.65
MM1 pKa = 7.61SFRR4 pKa = 11.84FNARR8 pKa = 11.84AVFLTYY14 pKa = 9.04PQCPLLKK21 pKa = 10.05QHH23 pKa = 6.15VLTMLRR29 pKa = 11.84TKK31 pKa = 10.65LGEE34 pKa = 4.35DD35 pKa = 3.4EE36 pKa = 4.28GTHH39 pKa = 5.17YY40 pKa = 11.19LIGQEE45 pKa = 4.09THH47 pKa = 7.17KK48 pKa = 11.11DD49 pKa = 3.74GTPHH53 pKa = 6.46LHH55 pKa = 6.05IFVEE59 pKa = 4.61RR60 pKa = 11.84GHH62 pKa = 7.38LINTRR67 pKa = 11.84NARR70 pKa = 11.84YY71 pKa = 9.21FDD73 pKa = 4.74LEE75 pKa = 4.32DD76 pKa = 3.71ASGIYY81 pKa = 9.34HH82 pKa = 6.95PNVTAPRR89 pKa = 11.84DD90 pKa = 3.42RR91 pKa = 11.84ADD93 pKa = 3.46VIRR96 pKa = 11.84YY97 pKa = 5.85ITKK100 pKa = 10.29EE101 pKa = 3.6DD102 pKa = 3.75TEE104 pKa = 4.29PVKK107 pKa = 10.55WPEE110 pKa = 3.35TWKK113 pKa = 10.6FDD115 pKa = 3.73EE116 pKa = 4.83PPKK119 pKa = 10.61KK120 pKa = 9.71RR121 pKa = 11.84SKK123 pKa = 10.04WEE125 pKa = 3.51QATPLLLEE133 pKa = 4.66GQDD136 pKa = 3.3AATLLKK142 pKa = 10.74SMPVFVLGNLKK153 pKa = 9.96KK154 pKa = 10.53VQEE157 pKa = 4.28ATAFLANIKK166 pKa = 9.27QQASLPPLEE175 pKa = 5.07TFLTWVLPAEE185 pKa = 4.38PEE187 pKa = 4.14YY188 pKa = 10.97EE189 pKa = 3.86RR190 pKa = 11.84NIAFKK195 pKa = 9.51TVWNEE200 pKa = 3.5LRR202 pKa = 11.84DD203 pKa = 3.91NLASKK208 pKa = 10.95DD209 pKa = 3.47FGRR212 pKa = 11.84RR213 pKa = 11.84QLYY216 pKa = 9.78LHH218 pKa = 6.95GPTGIGKK225 pKa = 8.25STFLRR230 pKa = 11.84HH231 pKa = 6.51LLMCIRR237 pKa = 11.84TYY239 pKa = 10.77ILPNEE244 pKa = 4.28DD245 pKa = 5.16WYY247 pKa = 10.75DD248 pKa = 3.17HH249 pKa = 6.59WDD251 pKa = 3.51NNLFDD256 pKa = 4.81LSVMEE261 pKa = 4.32EE262 pKa = 4.02FKK264 pKa = 10.89GQKK267 pKa = 9.61SIQWLNQWLDD277 pKa = 3.35EE278 pKa = 3.81AHH280 pKa = 6.79FYY282 pKa = 10.96VKK284 pKa = 10.42RR285 pKa = 11.84KK286 pKa = 9.61GVAGLLKK293 pKa = 9.78TNPIPTILISNFDD306 pKa = 3.77INSSDD311 pKa = 3.75VYY313 pKa = 11.23PNMQEE318 pKa = 4.06SVSIQTLRR326 pKa = 11.84RR327 pKa = 11.84RR328 pKa = 11.84LRR330 pKa = 11.84SLPVDD335 pKa = 3.81STCMHH340 pKa = 7.64LLTKK344 pKa = 10.49ALRR347 pKa = 11.84QFLSSIGASLPHH359 pKa = 6.36IQGDD363 pKa = 4.27VPQTPPLNAAQEE375 pKa = 4.38IVNPLWRR382 pKa = 11.84GPEE385 pKa = 3.92VTTVLPAPPVGGQTEE400 pKa = 4.48HH401 pKa = 5.95TCYY404 pKa = 10.08GQNGAPFRR412 pKa = 11.84DD413 pKa = 3.39EE414 pKa = 5.16CGPSTCNAWHH424 pKa = 6.65
Molecular weight: 48.52 kDa
Isoelectric point according different methods:
Protein with the highest isoelectric point:
>tr|A0A346BPE6|A0A346BPE6_9VIRU Coat protein OS=Giant house spider associated circular virus 4 OX=2293291 PE=4 SV=1
MM1 pKa = 7.81PKK3 pKa = 9.93RR4 pKa = 11.84RR5 pKa = 11.84LTYY8 pKa = 10.66DD9 pKa = 3.19SVKK12 pKa = 10.96DD13 pKa = 3.63MPLSKK18 pKa = 10.16LKK20 pKa = 10.74KK21 pKa = 8.96VMRR24 pKa = 11.84RR25 pKa = 11.84RR26 pKa = 11.84NRR28 pKa = 11.84APRR31 pKa = 11.84SYY33 pKa = 10.9RR34 pKa = 11.84SGARR38 pKa = 11.84VKK40 pKa = 10.97GSIARR45 pKa = 11.84YY46 pKa = 9.43GGRR49 pKa = 11.84QEE51 pKa = 4.95LKK53 pKa = 10.95YY54 pKa = 10.95VDD56 pKa = 3.64TDD58 pKa = 3.81LTGGTALYY66 pKa = 7.58DD67 pKa = 3.75TTGLATPVNLLAIGDD82 pKa = 4.54DD83 pKa = 3.45NTSRR87 pKa = 11.84DD88 pKa = 3.41GRR90 pKa = 11.84QVTVKK95 pKa = 10.24SIQVQGSVFPVDD107 pKa = 3.46QGAGPTLCRR116 pKa = 11.84SMIVWDD122 pKa = 4.14AMNNSASTTSAQLIAALLQASTSNAFPLIDD152 pKa = 3.44NQQRR156 pKa = 11.84FTVLWDD162 pKa = 3.23SHH164 pKa = 7.71KK165 pKa = 10.72MLGQISNTATQALSPNPGAHH185 pKa = 5.79ILKK188 pKa = 9.65YY189 pKa = 9.69YY190 pKa = 10.59RR191 pKa = 11.84KK192 pKa = 8.97ISQVTQYY199 pKa = 11.08SGTTAAIGSIQSGALWFVTLGDD221 pKa = 3.47NAAGVGGQFIGRR233 pKa = 11.84VRR235 pKa = 11.84VRR237 pKa = 11.84FTDD240 pKa = 3.23NN241 pKa = 2.94
MM1 pKa = 7.81PKK3 pKa = 9.93RR4 pKa = 11.84RR5 pKa = 11.84LTYY8 pKa = 10.66DD9 pKa = 3.19SVKK12 pKa = 10.96DD13 pKa = 3.63MPLSKK18 pKa = 10.16LKK20 pKa = 10.74KK21 pKa = 8.96VMRR24 pKa = 11.84RR25 pKa = 11.84RR26 pKa = 11.84NRR28 pKa = 11.84APRR31 pKa = 11.84SYY33 pKa = 10.9RR34 pKa = 11.84SGARR38 pKa = 11.84VKK40 pKa = 10.97GSIARR45 pKa = 11.84YY46 pKa = 9.43GGRR49 pKa = 11.84QEE51 pKa = 4.95LKK53 pKa = 10.95YY54 pKa = 10.95VDD56 pKa = 3.64TDD58 pKa = 3.81LTGGTALYY66 pKa = 7.58DD67 pKa = 3.75TTGLATPVNLLAIGDD82 pKa = 4.54DD83 pKa = 3.45NTSRR87 pKa = 11.84DD88 pKa = 3.41GRR90 pKa = 11.84QVTVKK95 pKa = 10.24SIQVQGSVFPVDD107 pKa = 3.46QGAGPTLCRR116 pKa = 11.84SMIVWDD122 pKa = 4.14AMNNSASTTSAQLIAALLQASTSNAFPLIDD152 pKa = 3.44NQQRR156 pKa = 11.84FTVLWDD162 pKa = 3.23SHH164 pKa = 7.71KK165 pKa = 10.72MLGQISNTATQALSPNPGAHH185 pKa = 5.79ILKK188 pKa = 9.65YY189 pKa = 9.69YY190 pKa = 10.59RR191 pKa = 11.84KK192 pKa = 8.97ISQVTQYY199 pKa = 11.08SGTTAAIGSIQSGALWFVTLGDD221 pKa = 3.47NAAGVGGQFIGRR233 pKa = 11.84VRR235 pKa = 11.84VRR237 pKa = 11.84FTDD240 pKa = 3.23NN241 pKa = 2.94
Molecular weight: 26.18 kDa
Isoelectric point according different methods:
Peptides (in silico digests for buttom-up proteomics)
Below you can find in silico digests of the whole proteome with Trypsin, Chymotrypsin, Trypsin+LysC, LysN, ArgC proteases suitable for different mass spec machines.| Try ESI |
 |
|---|
| ChTry ESI |
 |
|---|
| ArgC ESI |
 |
|---|
| LysN ESI |
 |
|---|
| TryLysC ESI |
 |
|---|
| Try MALDI |
 |
|---|
| ChTry MALDI |
 |
|---|
| ArgC MALDI |
 |
|---|
| LysN MALDI |
 |
|---|
| TryLysC MALDI |
 |
|---|
| Try LTQ |
 |
|---|
| ChTry LTQ |
 |
|---|
| ArgC LTQ |
 |
|---|
| LysN LTQ |
 |
|---|
| TryLysC LTQ |
 |
|---|
| Try MSlow |
 |
|---|
| ChTry MSlow |
 |
|---|
| ArgC MSlow |
 |
|---|
| LysN MSlow |
 |
|---|
| TryLysC MSlow |
 |
|---|
| Try MShigh |
 |
|---|
| ChTry MShigh |
 |
|---|
| ArgC MShigh |
 |
|---|
| LysN MShigh |
 |
|---|
| TryLysC MShigh |
 |
|---|
General Statistics
Number of major isoforms |
Number of additional isoforms |
Number of all proteins |
Number of amino acids |
Min. Seq. Length |
Max. Seq. Length |
Avg. Seq. Length |
Avg. Mol. Weight |
|---|---|---|---|---|---|---|---|
0 |
665 |
241 |
424 |
332.5 |
37.35 |
Amino acid frequency
Ala |
Cys |
Asp |
Glu |
Phe |
Gly |
His |
Ile |
Lys |
Leu |
|---|---|---|---|---|---|---|---|---|---|
7.068 ± 1.261 | 1.053 ± 0.39 |
5.263 ± 0.334 | 4.06 ± 2.23 |
3.609 ± 0.685 | 6.767 ± 1.445 |
2.556 ± 1.056 | 4.812 ± 0.102 |
4.962 ± 0.244 | 10.226 ± 1.179 |
Met |
Asn |
Gln |
Pro |
Arg |
Ser |
Thr |
Val |
Trp |
Tyr |
|---|---|---|---|---|---|---|---|---|---|
1.955 ± 0.327 | 4.812 ± 0.152 |
6.165 ± 1.487 | 5.263 ± 0.588 |
6.466 ± 0.867 | 6.165 ± 1.559 |
7.82 ± 0.547 | 5.865 ± 0.728 |
2.105 ± 0.526 | 3.008 ± 0.191 |
Most of the basic statistics you can see at this page can be downloaded from this CSV file
Proteome-pI is available under Creative Commons Attribution-NoDerivs license, for more details see here
| Reference: Kozlowski LP. Proteome-pI 2.0: Proteome Isoelectric Point Database Update. Nucleic Acids Res. 2021, doi: 10.1093/nar/gkab944 | Contact: Lukasz P. Kozlowski |
