Acidimicrobium ferrooxidans (strain DSM 10331 / JCM 15462 / NBRC 103882 / ICP)
Taxonomy: cellular organisms; Bacteria; Terrabacteria group; Actinobacteria; Acidimicrobiia; Acidimicrobiales; Acidimicrobiaceae; Acidimicrobium; Acidimicrobium ferrooxidans
Average proteome isoelectric point is 6.39
Get precalculated fractions of proteins

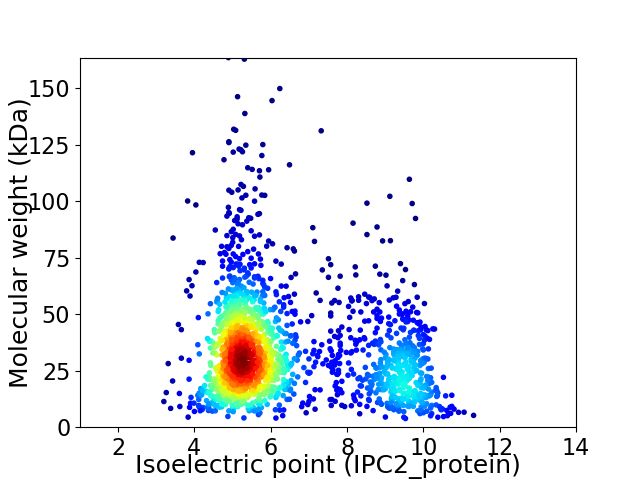
Virtual 2D-PAGE plot for 1935 proteins (isoelectric point calculated using IPC2_protein)
Get csv file with sequences according to given criteria:
* You can choose from 21 different methods for calculating isoelectric point
Summary statistics related to proteome-wise predictions


Protein with the lowest isoelectric point:
>tr|C7LZI9|C7LZI9_ACIFD Holliday junction ATP-dependent DNA helicase RuvA OS=Acidimicrobium ferrooxidans (strain DSM 10331 / JCM 15462 / NBRC 103882 / ICP) OX=525909 GN=ruvA PE=3 SV=1
MM1 pKa = 7.31TVTEE5 pKa = 4.66PGRR8 pKa = 11.84VTCVPTTHH16 pKa = 6.77ACSEE20 pKa = 3.98RR21 pKa = 11.84SYY23 pKa = 11.24LLDD26 pKa = 2.94VFYY29 pKa = 10.32PSRR32 pKa = 11.84TASSTIVADD41 pKa = 3.81APVASVGGPYY51 pKa = 10.19PLIVFAAGFDD61 pKa = 4.15EE62 pKa = 5.79DD63 pKa = 3.81PSAYY67 pKa = 10.31VPLIEE72 pKa = 3.97AWVRR76 pKa = 11.84AGYY79 pKa = 9.81VVAAPRR85 pKa = 11.84FPLSSAWALATYY97 pKa = 10.2GVDD100 pKa = 3.29LHH102 pKa = 7.05DD103 pKa = 5.0AAIADD108 pKa = 3.86AFEE111 pKa = 6.29SDD113 pKa = 3.93MLNEE117 pKa = 4.83PGDD120 pKa = 3.59LSAAIGEE127 pKa = 4.19MDD129 pKa = 3.47VLARR133 pKa = 11.84SGVLAGRR140 pKa = 11.84VATDD144 pKa = 3.57DD145 pKa = 3.54VALAGQSDD153 pKa = 3.92GGDD156 pKa = 3.37VVLASADD163 pKa = 3.77NTCCAIPGVRR173 pKa = 11.84AVAVLSGAVFSPFGGSFFGSSVPMLVVQGSADD205 pKa = 3.66TVNPPSASQAIYY217 pKa = 11.15ADD219 pKa = 3.54AQAPKK224 pKa = 10.16YY225 pKa = 10.72LEE227 pKa = 3.95WLLGADD233 pKa = 3.41HH234 pKa = 7.38LGPYY238 pKa = 6.57TTEE241 pKa = 4.41GPAEE245 pKa = 3.93QAVAAVSIAFFDD257 pKa = 3.66TYY259 pKa = 10.49LRR261 pKa = 11.84QMAPSVTQVATIGQVSGVATEE282 pKa = 4.13EE283 pKa = 4.17ADD285 pKa = 3.49VDD287 pKa = 4.27GSS289 pKa = 3.63
MM1 pKa = 7.31TVTEE5 pKa = 4.66PGRR8 pKa = 11.84VTCVPTTHH16 pKa = 6.77ACSEE20 pKa = 3.98RR21 pKa = 11.84SYY23 pKa = 11.24LLDD26 pKa = 2.94VFYY29 pKa = 10.32PSRR32 pKa = 11.84TASSTIVADD41 pKa = 3.81APVASVGGPYY51 pKa = 10.19PLIVFAAGFDD61 pKa = 4.15EE62 pKa = 5.79DD63 pKa = 3.81PSAYY67 pKa = 10.31VPLIEE72 pKa = 3.97AWVRR76 pKa = 11.84AGYY79 pKa = 9.81VVAAPRR85 pKa = 11.84FPLSSAWALATYY97 pKa = 10.2GVDD100 pKa = 3.29LHH102 pKa = 7.05DD103 pKa = 5.0AAIADD108 pKa = 3.86AFEE111 pKa = 6.29SDD113 pKa = 3.93MLNEE117 pKa = 4.83PGDD120 pKa = 3.59LSAAIGEE127 pKa = 4.19MDD129 pKa = 3.47VLARR133 pKa = 11.84SGVLAGRR140 pKa = 11.84VATDD144 pKa = 3.57DD145 pKa = 3.54VALAGQSDD153 pKa = 3.92GGDD156 pKa = 3.37VVLASADD163 pKa = 3.77NTCCAIPGVRR173 pKa = 11.84AVAVLSGAVFSPFGGSFFGSSVPMLVVQGSADD205 pKa = 3.66TVNPPSASQAIYY217 pKa = 11.15ADD219 pKa = 3.54AQAPKK224 pKa = 10.16YY225 pKa = 10.72LEE227 pKa = 3.95WLLGADD233 pKa = 3.41HH234 pKa = 7.38LGPYY238 pKa = 6.57TTEE241 pKa = 4.41GPAEE245 pKa = 3.93QAVAAVSIAFFDD257 pKa = 3.66TYY259 pKa = 10.49LRR261 pKa = 11.84QMAPSVTQVATIGQVSGVATEE282 pKa = 4.13EE283 pKa = 4.17ADD285 pKa = 3.49VDD287 pKa = 4.27GSS289 pKa = 3.63
Molecular weight: 29.59 kDa
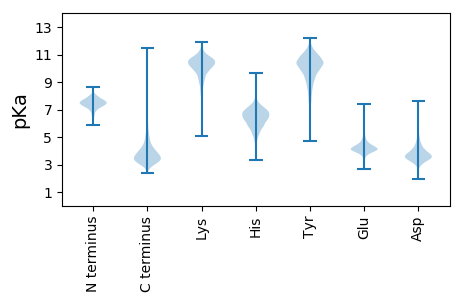
Isoelectric point according different methods:
Protein with the highest isoelectric point:
>tr|C7M2F8|C7M2F8_ACIFD Peptidase M20 OS=Acidimicrobium ferrooxidans (strain DSM 10331 / JCM 15462 / NBRC 103882 / ICP) OX=525909 GN=Afer_0233 PE=4 SV=1
MM1 pKa = 7.44KK2 pKa = 9.6RR3 pKa = 11.84TFQPNNRR10 pKa = 11.84RR11 pKa = 11.84RR12 pKa = 11.84ARR14 pKa = 11.84THH16 pKa = 5.8GFRR19 pKa = 11.84ARR21 pKa = 11.84MSTRR25 pKa = 11.84AGRR28 pKa = 11.84AVLKK32 pKa = 10.56ARR34 pKa = 11.84RR35 pKa = 11.84LKK37 pKa = 10.54GRR39 pKa = 11.84HH40 pKa = 5.49RR41 pKa = 11.84LSAA44 pKa = 3.8
MM1 pKa = 7.44KK2 pKa = 9.6RR3 pKa = 11.84TFQPNNRR10 pKa = 11.84RR11 pKa = 11.84RR12 pKa = 11.84ARR14 pKa = 11.84THH16 pKa = 5.8GFRR19 pKa = 11.84ARR21 pKa = 11.84MSTRR25 pKa = 11.84AGRR28 pKa = 11.84AVLKK32 pKa = 10.56ARR34 pKa = 11.84RR35 pKa = 11.84LKK37 pKa = 10.54GRR39 pKa = 11.84HH40 pKa = 5.49RR41 pKa = 11.84LSAA44 pKa = 3.8
Molecular weight: 5.23 kDa
Isoelectric point according different methods:
Peptides (in silico digests for buttom-up proteomics)
Below you can find in silico digests of the whole proteome with Trypsin, Chymotrypsin, Trypsin+LysC, LysN, ArgC proteases suitable for different mass spec machines.| Try ESI |
 |
|---|
| ChTry ESI |
 |
|---|
| ArgC ESI |
 |
|---|
| LysN ESI |
 |
|---|
| TryLysC ESI |
 |
|---|
| Try MALDI |
 |
|---|
| ChTry MALDI |
 |
|---|
| ArgC MALDI |
 |
|---|
| LysN MALDI |
 |
|---|
| TryLysC MALDI |
 |
|---|
| Try LTQ |
 |
|---|
| ChTry LTQ |
 |
|---|
| ArgC LTQ |
 |
|---|
| LysN LTQ |
 |
|---|
| TryLysC LTQ |
 |
|---|
| Try MSlow |
 |
|---|
| ChTry MSlow |
 |
|---|
| ArgC MSlow |
 |
|---|
| LysN MSlow |
 |
|---|
| TryLysC MSlow |
 |
|---|
| Try MShigh |
 |
|---|
| ChTry MShigh |
 |
|---|
| ArgC MShigh |
 |
|---|
| LysN MShigh |
 |
|---|
| TryLysC MShigh |
 |
|---|
General Statistics
Number of major isoforms |
Number of additional isoforms |
Number of all proteins |
Number of amino acids |
Min. Seq. Length |
Max. Seq. Length |
Avg. Seq. Length |
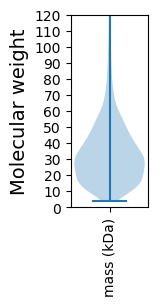
Avg. Mol. Weight |
|---|---|---|---|---|---|---|---|
0 |
632458 |
35 |
1518 |
326.9 |
34.99 |
Amino acid frequency
Ala |
Cys |
Asp |
Glu |
Phe |
Gly |
His |
Ile |
Lys |
Leu |
|---|---|---|---|---|---|---|---|---|---|
13.805 ± 0.073 | 0.61 ± 0.013 |
5.449 ± 0.052 | 6.11 ± 0.058 |
2.716 ± 0.036 | 8.924 ± 0.059 |
2.197 ± 0.024 | 4.103 ± 0.042 |
1.272 ± 0.031 | 10.886 ± 0.06 |
Met |
Asn |
Gln |
Pro |
Arg |
Ser |
Thr |
Val |
Trp |
Tyr |
|---|---|---|---|---|---|---|---|---|---|
1.567 ± 0.019 | 1.581 ± 0.032 |
5.491 ± 0.038 | 2.554 ± 0.035 |
8.674 ± 0.07 | 5.503 ± 0.047 |
5.395 ± 0.045 | 9.936 ± 0.065 |
1.429 ± 0.026 | 1.798 ± 0.029 |
Most of the basic statistics you can see at this page can be downloaded from this CSV file
Proteome-pI is available under Creative Commons Attribution-NoDerivs license, for more details see here
| Reference: Kozlowski LP. Proteome-pI 2.0: Proteome Isoelectric Point Database Update. Nucleic Acids Res. 2021, doi: 10.1093/nar/gkab944 | Contact: Lukasz P. Kozlowski |
