Blumeria graminis f. sp. hordei (Barley powdery mildew) (Oidium monilioides f. sp. hordei)
Taxonomy: cellular organisms; Eukaryota; Opisthokonta; Fungi; Dikarya; Ascomycota; saccharomyceta; Pezizomycotina; leotiomyceta; sordariomyceta; Leotiomycetes; Erysiphales; Erysiphaceae; Blumeria
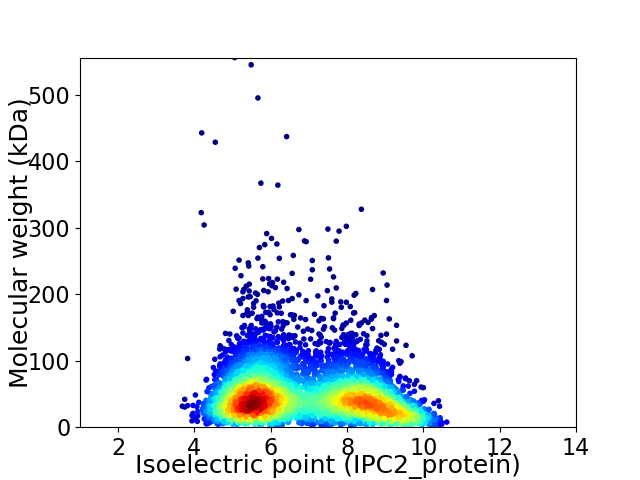
Average proteome isoelectric point is 6.91
Get precalculated fractions of proteins

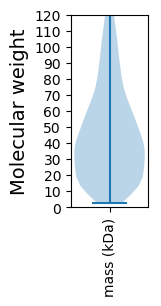
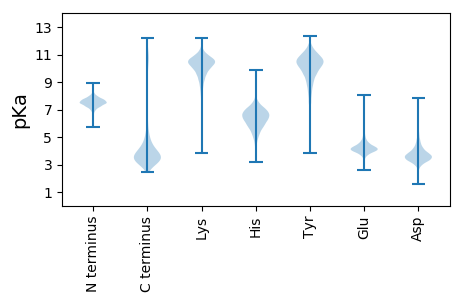
Virtual 2D-PAGE plot for 5276 proteins (isoelectric point calculated using IPC2_protein)
Get csv file with sequences according to given criteria:
* You can choose from 21 different methods for calculating isoelectric point
Summary statistics related to proteome-wise predictions


Protein with the lowest isoelectric point:
>tr|A0A383UHZ5|A0A383UHZ5_BLUGH Uncharacterized protein OS=Blumeria graminis f. sp. hordei OX=62688 GN=BLGHR1_10633 PE=4 SV=1
MM1 pKa = 7.85WEE3 pKa = 4.52LQAQCPPTHH12 pKa = 7.09PSYY15 pKa = 11.05HH16 pKa = 6.89PNQDD20 pKa = 2.82FDD22 pKa = 4.28NPGPSQISYY31 pKa = 10.6DD32 pKa = 3.67YY33 pKa = 11.2GITLVYY39 pKa = 10.4HH40 pKa = 6.7EE41 pKa = 5.76LPDD44 pKa = 4.29EE45 pKa = 4.5PTDD48 pKa = 4.94DD49 pKa = 5.14PFDD52 pKa = 4.03APNPSGSFRR61 pKa = 11.84EE62 pKa = 3.97ALGRR66 pKa = 11.84SVEE69 pKa = 4.04AAEE72 pKa = 4.29IQAKK76 pKa = 8.59EE77 pKa = 4.05AEE79 pKa = 4.26
MM1 pKa = 7.85WEE3 pKa = 4.52LQAQCPPTHH12 pKa = 7.09PSYY15 pKa = 11.05HH16 pKa = 6.89PNQDD20 pKa = 2.82FDD22 pKa = 4.28NPGPSQISYY31 pKa = 10.6DD32 pKa = 3.67YY33 pKa = 11.2GITLVYY39 pKa = 10.4HH40 pKa = 6.7EE41 pKa = 5.76LPDD44 pKa = 4.29EE45 pKa = 4.5PTDD48 pKa = 4.94DD49 pKa = 5.14PFDD52 pKa = 4.03APNPSGSFRR61 pKa = 11.84EE62 pKa = 3.97ALGRR66 pKa = 11.84SVEE69 pKa = 4.04AAEE72 pKa = 4.29IQAKK76 pKa = 8.59EE77 pKa = 4.05AEE79 pKa = 4.26
Molecular weight: 8.82 kDa
Isoelectric point according different methods:
Protein with the highest isoelectric point:
>tr|A0A383V0J2|A0A383V0J2_BLUGH Uncharacterized protein OS=Blumeria graminis f. sp. hordei OX=62688 GN=BLGHR1_16329 PE=4 SV=1
MM1 pKa = 7.39NISHH5 pKa = 8.12RR6 pKa = 11.84IRR8 pKa = 11.84SALTMTSLHH17 pKa = 6.48SPSSSTSSEE26 pKa = 3.76ADD28 pKa = 3.21DD29 pKa = 5.02SNLHH33 pKa = 6.38SPPTTPNPGRR43 pKa = 11.84GRR45 pKa = 11.84TLTSASSCSTSSIISLPALRR65 pKa = 11.84LKK67 pKa = 9.84KK68 pKa = 9.26TFTNLRR74 pKa = 11.84GAKK77 pKa = 8.1QRR79 pKa = 11.84RR80 pKa = 11.84KK81 pKa = 10.01DD82 pKa = 3.38EE83 pKa = 4.29RR84 pKa = 11.84YY85 pKa = 9.65RR86 pKa = 11.84EE87 pKa = 4.3ALAEE91 pKa = 3.82WAEE94 pKa = 3.78ADD96 pKa = 3.56EE97 pKa = 5.97RR98 pKa = 11.84EE99 pKa = 4.26WQYY102 pKa = 8.98PTWGGPAKK110 pKa = 10.38KK111 pKa = 9.68SRR113 pKa = 11.84KK114 pKa = 8.75FSRR117 pKa = 11.84EE118 pKa = 3.34QRR120 pKa = 11.84DD121 pKa = 3.77LLRR124 pKa = 11.84SWDD127 pKa = 3.46WHH129 pKa = 5.15QSTPRR134 pKa = 11.84TSLEE138 pKa = 3.43LRR140 pKa = 11.84TRR142 pKa = 11.84RR143 pKa = 11.84SSIFDD148 pKa = 4.26DD149 pKa = 4.73NISPCTSRR157 pKa = 11.84QNSLTGRR164 pKa = 11.84SSSLQGVYY172 pKa = 7.28TTAGRR177 pKa = 11.84HH178 pKa = 4.46QSVSTASSRR187 pKa = 11.84DD188 pKa = 3.32RR189 pKa = 11.84RR190 pKa = 11.84PCTVCGNEE198 pKa = 3.7
MM1 pKa = 7.39NISHH5 pKa = 8.12RR6 pKa = 11.84IRR8 pKa = 11.84SALTMTSLHH17 pKa = 6.48SPSSSTSSEE26 pKa = 3.76ADD28 pKa = 3.21DD29 pKa = 5.02SNLHH33 pKa = 6.38SPPTTPNPGRR43 pKa = 11.84GRR45 pKa = 11.84TLTSASSCSTSSIISLPALRR65 pKa = 11.84LKK67 pKa = 9.84KK68 pKa = 9.26TFTNLRR74 pKa = 11.84GAKK77 pKa = 8.1QRR79 pKa = 11.84RR80 pKa = 11.84KK81 pKa = 10.01DD82 pKa = 3.38EE83 pKa = 4.29RR84 pKa = 11.84YY85 pKa = 9.65RR86 pKa = 11.84EE87 pKa = 4.3ALAEE91 pKa = 3.82WAEE94 pKa = 3.78ADD96 pKa = 3.56EE97 pKa = 5.97RR98 pKa = 11.84EE99 pKa = 4.26WQYY102 pKa = 8.98PTWGGPAKK110 pKa = 10.38KK111 pKa = 9.68SRR113 pKa = 11.84KK114 pKa = 8.75FSRR117 pKa = 11.84EE118 pKa = 3.34QRR120 pKa = 11.84DD121 pKa = 3.77LLRR124 pKa = 11.84SWDD127 pKa = 3.46WHH129 pKa = 5.15QSTPRR134 pKa = 11.84TSLEE138 pKa = 3.43LRR140 pKa = 11.84TRR142 pKa = 11.84RR143 pKa = 11.84SSIFDD148 pKa = 4.26DD149 pKa = 4.73NISPCTSRR157 pKa = 11.84QNSLTGRR164 pKa = 11.84SSSLQGVYY172 pKa = 7.28TTAGRR177 pKa = 11.84HH178 pKa = 4.46QSVSTASSRR187 pKa = 11.84DD188 pKa = 3.32RR189 pKa = 11.84RR190 pKa = 11.84PCTVCGNEE198 pKa = 3.7
Molecular weight: 22.24 kDa
Isoelectric point according different methods:
Peptides (in silico digests for buttom-up proteomics)
Below you can find in silico digests of the whole proteome with Trypsin, Chymotrypsin, Trypsin+LysC, LysN, ArgC proteases suitable for different mass spec machines.| Try ESI |
 |
|---|
| ChTry ESI |
 |
|---|
| ArgC ESI |
 |
|---|
| LysN ESI |
 |
|---|
| TryLysC ESI |
 |
|---|
| Try MALDI |
 |
|---|
| ChTry MALDI |
 |
|---|
| ArgC MALDI |
 |
|---|
| LysN MALDI |
 |
|---|
| TryLysC MALDI |
 |
|---|
| Try LTQ |
 |
|---|
| ChTry LTQ |
 |
|---|
| ArgC LTQ |
 |
|---|
| LysN LTQ |
 |
|---|
| TryLysC LTQ |
 |
|---|
| Try MSlow |
 |
|---|
| ChTry MSlow |
 |
|---|
| ArgC MSlow |
 |
|---|
| LysN MSlow |
 |
|---|
| TryLysC MSlow |
 |
|---|
| Try MShigh |
 |
|---|
| ChTry MShigh |
 |
|---|
| ArgC MShigh |
 |
|---|
| LysN MShigh |
 |
|---|
| TryLysC MShigh |
 |
|---|
General Statistics
Number of major isoforms |
Number of additional isoforms |
Number of all proteins |
Number of amino acids |
Min. Seq. Length |
Max. Seq. Length |
Avg. Seq. Length |
Avg. Mol. Weight |
|---|---|---|---|---|---|---|---|
0 |
2485222 |
21 |
4885 |
471.0 |
52.76 |
Amino acid frequency
Ala |
Cys |
Asp |
Glu |
Phe |
Gly |
His |
Ile |
Lys |
Leu |
|---|---|---|---|---|---|---|---|---|---|
6.842 ± 0.028 | 1.375 ± 0.012 |
5.419 ± 0.025 | 6.489 ± 0.038 |
3.788 ± 0.022 | 5.694 ± 0.029 |
2.361 ± 0.013 | 6.143 ± 0.02 |
5.993 ± 0.031 | 9.074 ± 0.035 |
Met |
Asn |
Gln |
Pro |
Arg |
Ser |
Thr |
Val |
Trp |
Tyr |
|---|---|---|---|---|---|---|---|---|---|
2.133 ± 0.012 | 4.776 ± 0.02 |
5.318 ± 0.03 | 4.123 ± 0.021 |
5.821 ± 0.024 | 9.245 ± 0.043 |
5.92 ± 0.019 | 5.428 ± 0.023 |
1.222 ± 0.012 | 2.837 ± 0.017 |
Most of the basic statistics you can see at this page can be downloaded from this CSV file
Proteome-pI is available under Creative Commons Attribution-NoDerivs license, for more details see here
| Reference: Kozlowski LP. Proteome-pI 2.0: Proteome Isoelectric Point Database Update. Nucleic Acids Res. 2021, doi: 10.1093/nar/gkab944 | Contact: Lukasz P. Kozlowski |
