Eragrostis curvula streak virus (isolate Eragrostis curvula/South Africa/g382/2008)
Taxonomy: Viruses; Monodnaviria; Shotokuvirae; Cressdnaviricota; Repensiviricetes; Geplafuvirales; Geminiviridae; Eragrovirus; Eragrostis curvula streak virus
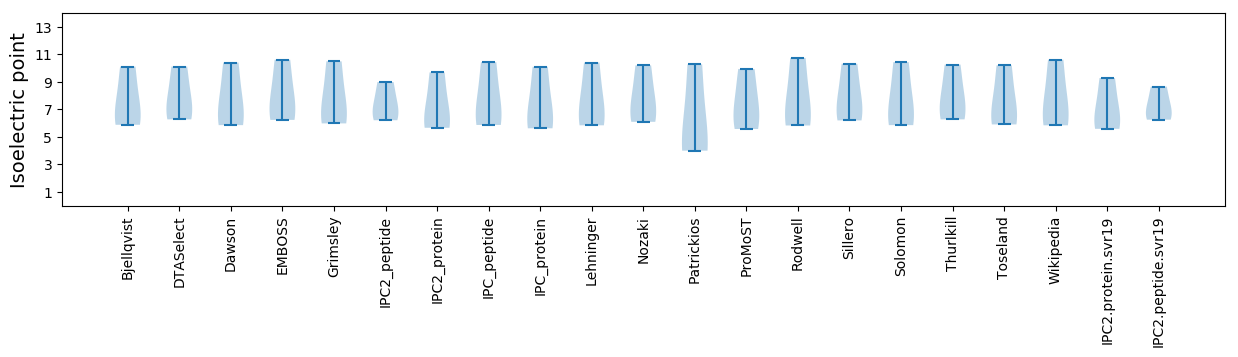
Average proteome isoelectric point is 7.08
Get precalculated fractions of proteins
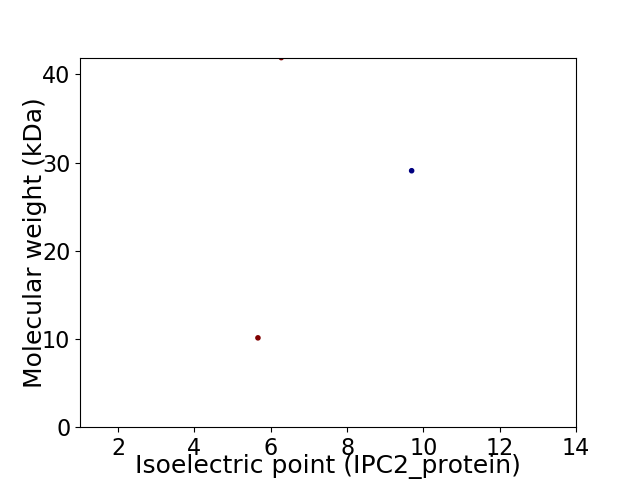
Virtual 2D-PAGE plot for 3 proteins (isoelectric point calculated using IPC2_protein)
Get csv file with sequences according to given criteria:
* You can choose from 21 different methods for calculating isoelectric point
Summary statistics related to proteome-wise predictions
Protein with the lowest isoelectric point:
>tr|C3UV59|C3UV59_ECSVG Capsid protein OS=Eragrostis curvula streak virus (isolate Eragrostis curvula/South Africa/g382/2008) OX=1559364 PE=3 SV=1
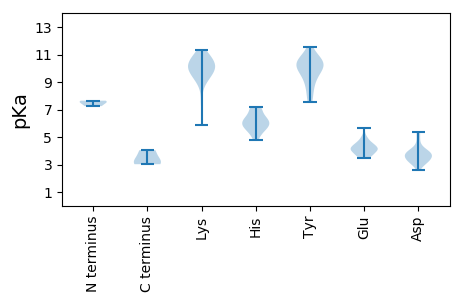
MM1 pKa = 7.54SGPPPCDD8 pKa = 2.59RR9 pKa = 11.84TEE11 pKa = 4.05PVQTIPLLLCHH22 pKa = 6.47GRR24 pKa = 11.84RR25 pKa = 11.84SLPLCHH31 pKa = 7.0AEE33 pKa = 4.03VLPPQDD39 pKa = 3.76LGQIRR44 pKa = 11.84YY45 pKa = 8.53LVKK48 pKa = 10.22RR49 pKa = 11.84FKK51 pKa = 11.05ARR53 pKa = 11.84VLIRR57 pKa = 11.84TIAEE61 pKa = 4.12QYY63 pKa = 10.31SGSSLADD70 pKa = 3.27KK71 pKa = 11.31LEE73 pKa = 4.92LIWTFCDD80 pKa = 3.62TLQHH84 pKa = 5.73EE85 pKa = 4.93AEE87 pKa = 4.39EE88 pKa = 4.43EE89 pKa = 4.04
MM1 pKa = 7.54SGPPPCDD8 pKa = 2.59RR9 pKa = 11.84TEE11 pKa = 4.05PVQTIPLLLCHH22 pKa = 6.47GRR24 pKa = 11.84RR25 pKa = 11.84SLPLCHH31 pKa = 7.0AEE33 pKa = 4.03VLPPQDD39 pKa = 3.76LGQIRR44 pKa = 11.84YY45 pKa = 8.53LVKK48 pKa = 10.22RR49 pKa = 11.84FKK51 pKa = 11.05ARR53 pKa = 11.84VLIRR57 pKa = 11.84TIAEE61 pKa = 4.12QYY63 pKa = 10.31SGSSLADD70 pKa = 3.27KK71 pKa = 11.31LEE73 pKa = 4.92LIWTFCDD80 pKa = 3.62TLQHH84 pKa = 5.73EE85 pKa = 4.93AEE87 pKa = 4.39EE88 pKa = 4.43EE89 pKa = 4.04
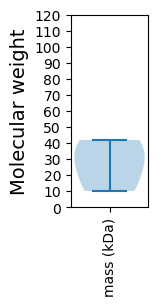
Molecular weight: 10.13 kDa
Isoelectric point according different methods:
Protein with the highest isoelectric point:
>tr|C3UV60|C3UV60_ECSVG Replication-associated protein OS=Eragrostis curvula streak virus (isolate Eragrostis curvula/South Africa/g382/2008) OX=1559364 PE=3 SV=1
MM1 pKa = 7.25KK2 pKa = 10.2RR3 pKa = 11.84KK4 pKa = 9.98RR5 pKa = 11.84NEE7 pKa = 3.49AVPAGRR13 pKa = 11.84RR14 pKa = 11.84YY15 pKa = 7.56PQRR18 pKa = 11.84RR19 pKa = 11.84RR20 pKa = 11.84MYY22 pKa = 8.94YY23 pKa = 9.74RR24 pKa = 11.84PRR26 pKa = 11.84KK27 pKa = 9.07PFFPRR32 pKa = 11.84PVYY35 pKa = 9.8TRR37 pKa = 11.84SSSVKK42 pKa = 10.13RR43 pKa = 11.84PALQISGLVYY53 pKa = 10.72GNSSTGAVKK62 pKa = 10.48INTGALSLVTAFKK75 pKa = 10.9AGTAEE80 pKa = 4.15EE81 pKa = 4.72CRR83 pKa = 11.84HH84 pKa = 5.51SNQTIVKK91 pKa = 9.19SFDD94 pKa = 3.02ISGTLYY100 pKa = 10.21VQSPTSSNCGPVVVYY115 pKa = 8.44FWLIYY120 pKa = 10.41DD121 pKa = 3.97SEE123 pKa = 4.23PRR125 pKa = 11.84QAIPNITDD133 pKa = 3.44VFSMPWTSVPSSWRR147 pKa = 11.84ISRR150 pKa = 11.84SSSHH154 pKa = 6.24RR155 pKa = 11.84FVVKK159 pKa = 10.41RR160 pKa = 11.84KK161 pKa = 5.9WHH163 pKa = 5.94YY164 pKa = 10.77EE165 pKa = 3.86LMSDD169 pKa = 4.97GVLPQSNTKK178 pKa = 9.56VQTHH182 pKa = 5.82NPVSRR187 pKa = 11.84NMMDD191 pKa = 3.68FSKK194 pKa = 10.94YY195 pKa = 9.92INNLGVPTEE204 pKa = 4.1WMSTGDD210 pKa = 3.64GTIGDD215 pKa = 3.98IKK217 pKa = 10.82KK218 pKa = 10.37GALYY222 pKa = 10.24LAAACRR228 pKa = 11.84QGIVGDD234 pKa = 3.71ATKK237 pKa = 9.22ITIEE241 pKa = 4.15VEE243 pKa = 4.59FIGQSRR249 pKa = 11.84TYY251 pKa = 9.41FKK253 pKa = 11.05SIGYY257 pKa = 7.76QQ258 pKa = 3.02
MM1 pKa = 7.25KK2 pKa = 10.2RR3 pKa = 11.84KK4 pKa = 9.98RR5 pKa = 11.84NEE7 pKa = 3.49AVPAGRR13 pKa = 11.84RR14 pKa = 11.84YY15 pKa = 7.56PQRR18 pKa = 11.84RR19 pKa = 11.84RR20 pKa = 11.84MYY22 pKa = 8.94YY23 pKa = 9.74RR24 pKa = 11.84PRR26 pKa = 11.84KK27 pKa = 9.07PFFPRR32 pKa = 11.84PVYY35 pKa = 9.8TRR37 pKa = 11.84SSSVKK42 pKa = 10.13RR43 pKa = 11.84PALQISGLVYY53 pKa = 10.72GNSSTGAVKK62 pKa = 10.48INTGALSLVTAFKK75 pKa = 10.9AGTAEE80 pKa = 4.15EE81 pKa = 4.72CRR83 pKa = 11.84HH84 pKa = 5.51SNQTIVKK91 pKa = 9.19SFDD94 pKa = 3.02ISGTLYY100 pKa = 10.21VQSPTSSNCGPVVVYY115 pKa = 8.44FWLIYY120 pKa = 10.41DD121 pKa = 3.97SEE123 pKa = 4.23PRR125 pKa = 11.84QAIPNITDD133 pKa = 3.44VFSMPWTSVPSSWRR147 pKa = 11.84ISRR150 pKa = 11.84SSSHH154 pKa = 6.24RR155 pKa = 11.84FVVKK159 pKa = 10.41RR160 pKa = 11.84KK161 pKa = 5.9WHH163 pKa = 5.94YY164 pKa = 10.77EE165 pKa = 3.86LMSDD169 pKa = 4.97GVLPQSNTKK178 pKa = 9.56VQTHH182 pKa = 5.82NPVSRR187 pKa = 11.84NMMDD191 pKa = 3.68FSKK194 pKa = 10.94YY195 pKa = 9.92INNLGVPTEE204 pKa = 4.1WMSTGDD210 pKa = 3.64GTIGDD215 pKa = 3.98IKK217 pKa = 10.82KK218 pKa = 10.37GALYY222 pKa = 10.24LAAACRR228 pKa = 11.84QGIVGDD234 pKa = 3.71ATKK237 pKa = 9.22ITIEE241 pKa = 4.15VEE243 pKa = 4.59FIGQSRR249 pKa = 11.84TYY251 pKa = 9.41FKK253 pKa = 11.05SIGYY257 pKa = 7.76QQ258 pKa = 3.02
Molecular weight: 29.07 kDa
Isoelectric point according different methods:
Peptides (in silico digests for buttom-up proteomics)
Below you can find in silico digests of the whole proteome with Trypsin, Chymotrypsin, Trypsin+LysC, LysN, ArgC proteases suitable for different mass spec machines.| Try ESI |
 |
|---|
| ChTry ESI |
|
|---|
| ArgC ESI |
|
|---|
| LysN ESI |
|
|---|
| TryLysC ESI |
|
|---|
| Try MALDI |
|
|---|
| ChTry MALDI |
|
|---|
| ArgC MALDI |
|
|---|
| LysN MALDI |
|
|---|
| TryLysC MALDI |
|
|---|
| Try LTQ |
|
|---|
| ChTry LTQ |
|
|---|
| ArgC LTQ |
|
|---|
| LysN LTQ |
|
|---|
| TryLysC LTQ |
|
|---|
| Try MSlow |
|
|---|
| ChTry MSlow |
|
|---|
| ArgC MSlow |
|
|---|
| LysN MSlow |
|
|---|
| TryLysC MSlow |
|
|---|
| Try MShigh |
|
|---|
| ChTry MShigh |
|
|---|
| ArgC MShigh |
|
|---|
| LysN MShigh |
|
|---|
| TryLysC MShigh |
|
|---|
General Statistics
Number of major isoforms |
Number of additional isoforms |
Number of all proteins |
Number of amino acids |
Min. Seq. Length |
Max. Seq. Length |
Avg. Seq. Length |
Avg. Mol. Weight |
|---|---|---|---|---|---|---|---|
0 |
714 |
89 |
367 |
238.0 |
27.03 |
Amino acid frequency
Ala |
Cys |
Asp |
Glu |
Phe |
Gly |
His |
Ile |
Lys |
Leu |
|---|---|---|---|---|---|---|---|---|---|
5.742 ± 0.156 | 1.961 ± 0.569 |
5.322 ± 1.094 | 5.462 ± 1.098 |
3.922 ± 0.394 | 6.022 ± 0.454 |
3.081 ± 0.678 | 4.902 ± 0.669 |
5.742 ± 0.536 | 7.283 ± 1.765 |
Met |
Asn |
Gln |
Pro |
Arg |
Ser |
Thr |
Val |
Trp |
Tyr |
|---|---|---|---|---|---|---|---|---|---|
1.401 ± 0.579 | 3.782 ± 0.82 |
5.742 ± 0.844 | 4.482 ± 0.307 |
7.283 ± 0.455 | 9.524 ± 0.964 |
5.462 ± 0.704 | 7.143 ± 0.62 |
2.241 ± 0.332 | 3.501 ± 0.658 |
Most of the basic statistics you can see at this page can be downloaded from this CSV file
See this proteome in:

Proteome-pI is available under Creative Commons Attribution-NoDerivs license, for more details see here
| Reference: Kozlowski LP. Proteome-pI 2.0: Proteome Isoelectric Point Database Update. Nucleic Acids Res. 2021, doi: 10.1093/nar/gkab944 | Contact: Lukasz P. Kozlowski |