Melon yellowing-associated virus
Taxonomy: Viruses; Riboviria; Orthornavirae; Kitrinoviricota; Alsuviricetes; Tymovirales; Betaflexiviridae; Quinvirinae; Carlavirus
Average proteome isoelectric point is 7.09
Get precalculated fractions of proteins
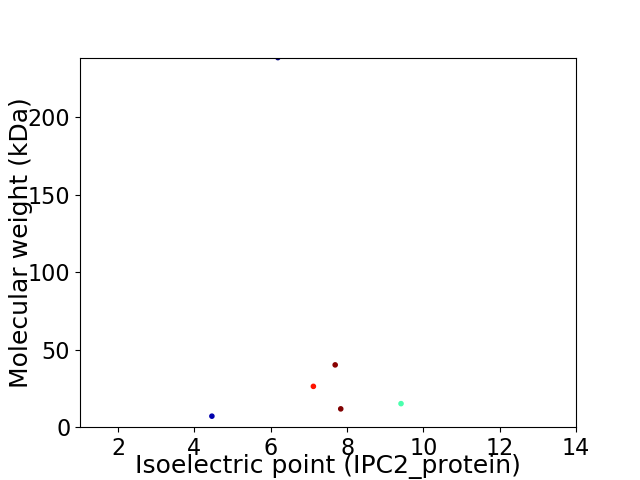
Virtual 2D-PAGE plot for 6 proteins (isoelectric point calculated using IPC2_protein)
Get csv file with sequences according to given criteria:
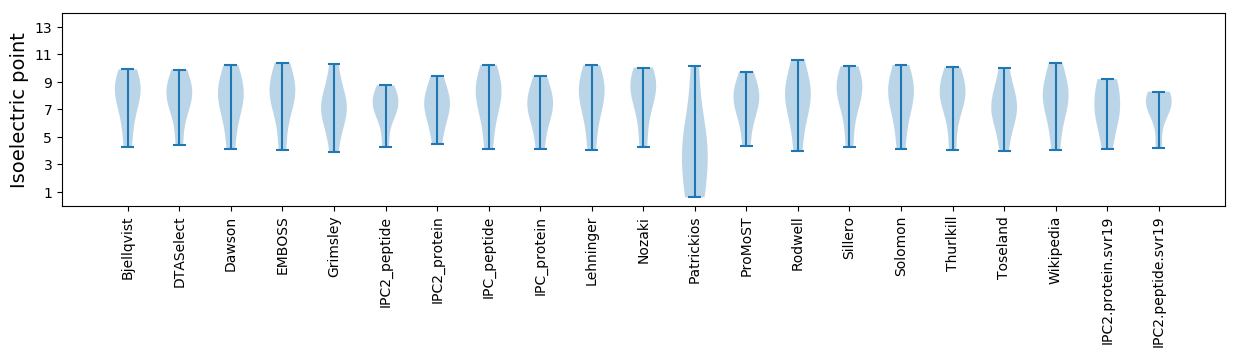
* You can choose from 21 different methods for calculating isoelectric point
Summary statistics related to proteome-wise predictions
Protein with the lowest isoelectric point:
>tr|A0A1W7HH44|A0A1W7HH44_9VIRU 7 kDa protein OS=Melon yellowing-associated virus OX=255255 GN=TGB3 PE=3 SV=1
MM1 pKa = 7.21WCEE4 pKa = 3.91SLIGLIAASLTFLILIYY21 pKa = 9.86FSRR24 pKa = 11.84EE25 pKa = 3.45NEE27 pKa = 4.12TCVLIVSKK35 pKa = 10.97SSLVVKK41 pKa = 10.65GCGNNVPDD49 pKa = 4.94ISNLDD54 pKa = 3.53LSFLQGVSCDD64 pKa = 3.7GLL66 pKa = 3.72
MM1 pKa = 7.21WCEE4 pKa = 3.91SLIGLIAASLTFLILIYY21 pKa = 9.86FSRR24 pKa = 11.84EE25 pKa = 3.45NEE27 pKa = 4.12TCVLIVSKK35 pKa = 10.97SSLVVKK41 pKa = 10.65GCGNNVPDD49 pKa = 4.94ISNLDD54 pKa = 3.53LSFLQGVSCDD64 pKa = 3.7GLL66 pKa = 3.72
Molecular weight: 7.11 kDa
Isoelectric point according different methods:
Protein with the highest isoelectric point:
>tr|A0A1W7HH39|A0A1W7HH39_9VIRU Capsid protein OS=Melon yellowing-associated virus OX=255255 GN=CP PE=3 SV=1
MM1 pKa = 8.0DD2 pKa = 5.57LVLKK6 pKa = 10.6QDD8 pKa = 3.93VGWLTVLLARR18 pKa = 11.84RR19 pKa = 11.84MGLDD23 pKa = 3.37YY24 pKa = 10.98DD25 pKa = 4.09ISRR28 pKa = 11.84SIAKK32 pKa = 10.02YY33 pKa = 9.13VVNYY37 pKa = 10.55NNGIRR42 pKa = 11.84TYY44 pKa = 9.68EE45 pKa = 4.12SYY47 pKa = 11.97VNGSSKK53 pKa = 10.32SAKK56 pKa = 9.19KK57 pKa = 10.03RR58 pKa = 11.84RR59 pKa = 11.84AKK61 pKa = 10.36RR62 pKa = 11.84FQVCVKK68 pKa = 9.89CARR71 pKa = 11.84PHH73 pKa = 5.28CTNGINCVPNTSSQINVSNLIEE95 pKa = 4.24MGVTRR100 pKa = 11.84YY101 pKa = 8.13LTEE104 pKa = 3.73STPRR108 pKa = 11.84KK109 pKa = 7.58GTHH112 pKa = 5.95VYY114 pKa = 10.9DD115 pKa = 3.83HH116 pKa = 6.73VKK118 pKa = 10.75SEE120 pKa = 4.38LGLIKK125 pKa = 10.84YY126 pKa = 9.98NSLKK130 pKa = 10.69VKK132 pKa = 10.46PKK134 pKa = 10.46
MM1 pKa = 8.0DD2 pKa = 5.57LVLKK6 pKa = 10.6QDD8 pKa = 3.93VGWLTVLLARR18 pKa = 11.84RR19 pKa = 11.84MGLDD23 pKa = 3.37YY24 pKa = 10.98DD25 pKa = 4.09ISRR28 pKa = 11.84SIAKK32 pKa = 10.02YY33 pKa = 9.13VVNYY37 pKa = 10.55NNGIRR42 pKa = 11.84TYY44 pKa = 9.68EE45 pKa = 4.12SYY47 pKa = 11.97VNGSSKK53 pKa = 10.32SAKK56 pKa = 9.19KK57 pKa = 10.03RR58 pKa = 11.84RR59 pKa = 11.84AKK61 pKa = 10.36RR62 pKa = 11.84FQVCVKK68 pKa = 9.89CARR71 pKa = 11.84PHH73 pKa = 5.28CTNGINCVPNTSSQINVSNLIEE95 pKa = 4.24MGVTRR100 pKa = 11.84YY101 pKa = 8.13LTEE104 pKa = 3.73STPRR108 pKa = 11.84KK109 pKa = 7.58GTHH112 pKa = 5.95VYY114 pKa = 10.9DD115 pKa = 3.83HH116 pKa = 6.73VKK118 pKa = 10.75SEE120 pKa = 4.38LGLIKK125 pKa = 10.84YY126 pKa = 9.98NSLKK130 pKa = 10.69VKK132 pKa = 10.46PKK134 pKa = 10.46
Molecular weight: 15.2 kDa
Isoelectric point according different methods:
Peptides (in silico digests for buttom-up proteomics)
Below you can find in silico digests of the whole proteome with Trypsin, Chymotrypsin, Trypsin+LysC, LysN, ArgC proteases suitable for different mass spec machines.| Try ESI |
 |
|---|
| ChTry ESI |
|
|---|
| ArgC ESI |
|
|---|
| LysN ESI |
|
|---|
| TryLysC ESI |
|
|---|
| Try MALDI |
|
|---|
| ChTry MALDI |
|
|---|
| ArgC MALDI |
|
|---|
| LysN MALDI |
|
|---|
| TryLysC MALDI |
|
|---|
| Try LTQ |
|
|---|
| ChTry LTQ |
|
|---|
| ArgC LTQ |
|
|---|
| LysN LTQ |
|
|---|
| TryLysC LTQ |
|
|---|
| Try MSlow |
|
|---|
| ChTry MSlow |
|
|---|
| ArgC MSlow |
|
|---|
| LysN MSlow |
|
|---|
| TryLysC MSlow |
|
|---|
| Try MShigh |
|
|---|
| ChTry MShigh |
|
|---|
| ArgC MShigh |
|
|---|
| LysN MShigh |
|
|---|
| TryLysC MShigh |
|
|---|
General Statistics
Number of major isoforms |
Number of additional isoforms |
Number of all proteins |
Number of amino acids |
Min. Seq. Length |
Max. Seq. Length |
Avg. Seq. Length |
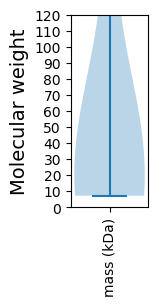
Avg. Mol. Weight |
|---|---|---|---|---|---|---|---|
0 |
2989 |
66 |
2087 |
498.2 |
56.49 |
Amino acid frequency
Ala |
Cys |
Asp |
Glu |
Phe |
Gly |
His |
Ile |
Lys |
Leu |
|---|---|---|---|---|---|---|---|---|---|
5.018 ± 0.542 | 2.509 ± 0.482 |
5.587 ± 0.498 | 6.858 ± 1.382 |
5.989 ± 1.086 | 6.056 ± 0.366 |
1.974 ± 0.145 | 6.39 ± 0.486 |
7.494 ± 0.674 | 9.167 ± 0.646 |
Met |
Asn |
Gln |
Pro |
Arg |
Ser |
Thr |
Val |
Trp |
Tyr |
|---|---|---|---|---|---|---|---|---|---|
2.041 ± 0.284 | 5.219 ± 0.673 |
3.446 ± 0.448 | 2.777 ± 0.349 |
5.286 ± 0.365 | 8.13 ± 1.569 |
5.286 ± 0.62 | 6.557 ± 0.677 |
0.87 ± 0.075 | 3.312 ± 0.68 |
Most of the basic statistics you can see at this page can be downloaded from this CSV file
See this proteome in:

Proteome-pI is available under Creative Commons Attribution-NoDerivs license, for more details see here
| Reference: Kozlowski LP. Proteome-pI 2.0: Proteome Isoelectric Point Database Update. Nucleic Acids Res. 2021, doi: 10.1093/nar/gkab944 | Contact: Lukasz P. Kozlowski |