Desulfobacter postgatei 2ac9
Taxonomy: cellular organisms; Bacteria; Proteobacteria; delta/epsilon subdivisions; Deltaproteobacteria; Desulfobacterales; Desulfobacteraceae; Desulfobacter; Desulfobacter postgatei
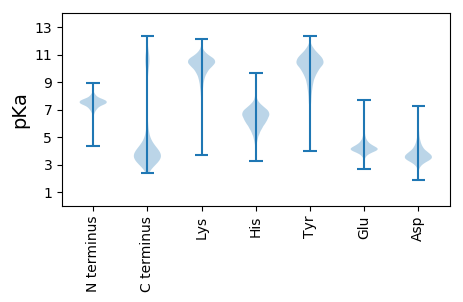
Average proteome isoelectric point is 6.69
Get precalculated fractions of proteins

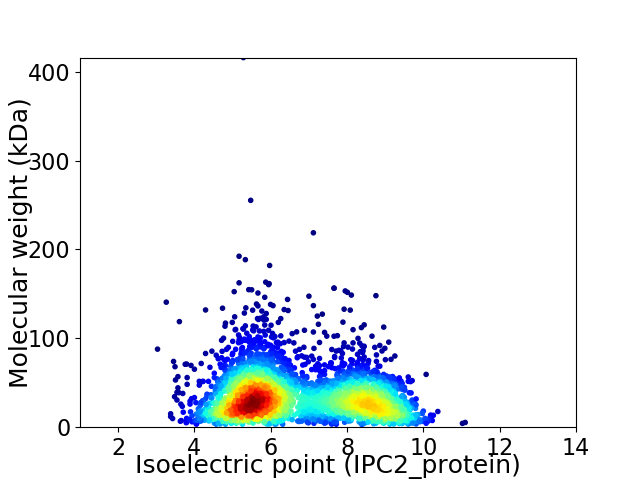
Virtual 2D-PAGE plot for 3396 proteins (isoelectric point calculated using IPC2_protein)
Get csv file with sequences according to given criteria:
* You can choose from 21 different methods for calculating isoelectric point
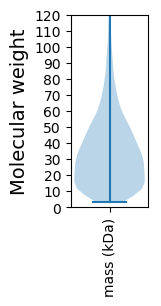
Summary statistics related to proteome-wise predictions


Protein with the lowest isoelectric point:
>tr|I5B4K9|I5B4K9_9DELT CRISPR_Cas6 domain-containing protein OS=Desulfobacter postgatei 2ac9 OX=879212 GN=DespoDRAFT_02577 PE=4 SV=1
MM1 pKa = 8.14DD2 pKa = 5.37NNLNPIPGALVEE14 pKa = 4.37GHH16 pKa = 5.85WSGLVSGNVSGTTSEE31 pKa = 3.81NGMIEE36 pKa = 4.31WVSAATIQSGTITFTVDD53 pKa = 3.46TISASGYY60 pKa = 10.89DD61 pKa = 4.01YY62 pKa = 11.25DD63 pKa = 4.5PSLNTVSSISIKK75 pKa = 7.77TQEE78 pKa = 4.54SSNQSPVAVIDD89 pKa = 3.88GGPVSGMEE97 pKa = 3.75GDD99 pKa = 3.87SIYY102 pKa = 10.97FEE104 pKa = 4.95GKK106 pKa = 9.89NSYY109 pKa = 10.93DD110 pKa = 3.52PDD112 pKa = 5.62AGDD115 pKa = 3.38TLSYY119 pKa = 8.52EE120 pKa = 3.56WRR122 pKa = 11.84MGEE125 pKa = 4.3EE126 pKa = 3.62ILSYY130 pKa = 9.38GTYY133 pKa = 10.35LIHH136 pKa = 6.9EE137 pKa = 5.14FSTAGTYY144 pKa = 9.26EE145 pKa = 3.98VILRR149 pKa = 11.84VEE151 pKa = 4.66DD152 pKa = 3.22DD153 pKa = 3.12WGAVSEE159 pKa = 4.73DD160 pKa = 3.57KK161 pKa = 10.81VTVTIEE167 pKa = 4.0AEE169 pKa = 4.09SGNDD173 pKa = 3.25AFIHH177 pKa = 5.5VSSIEE182 pKa = 3.94MQVSYY187 pKa = 10.97LGRR190 pKa = 11.84NSLGLATVKK199 pKa = 10.59VVDD202 pKa = 3.76QYY204 pKa = 12.25GNPIEE209 pKa = 4.16NAAIKK214 pKa = 9.6GVWSGVVTASQSGITAGDD232 pKa = 3.68GTVMFTSPKK241 pKa = 8.93TKK243 pKa = 9.89TSGEE247 pKa = 4.24FVFSVDD253 pKa = 3.07GVTASGYY260 pKa = 10.63VYY262 pKa = 10.95SPDD265 pKa = 4.62DD266 pKa = 3.68NVLEE270 pKa = 4.6LNSINNN276 pKa = 3.64
MM1 pKa = 8.14DD2 pKa = 5.37NNLNPIPGALVEE14 pKa = 4.37GHH16 pKa = 5.85WSGLVSGNVSGTTSEE31 pKa = 3.81NGMIEE36 pKa = 4.31WVSAATIQSGTITFTVDD53 pKa = 3.46TISASGYY60 pKa = 10.89DD61 pKa = 4.01YY62 pKa = 11.25DD63 pKa = 4.5PSLNTVSSISIKK75 pKa = 7.77TQEE78 pKa = 4.54SSNQSPVAVIDD89 pKa = 3.88GGPVSGMEE97 pKa = 3.75GDD99 pKa = 3.87SIYY102 pKa = 10.97FEE104 pKa = 4.95GKK106 pKa = 9.89NSYY109 pKa = 10.93DD110 pKa = 3.52PDD112 pKa = 5.62AGDD115 pKa = 3.38TLSYY119 pKa = 8.52EE120 pKa = 3.56WRR122 pKa = 11.84MGEE125 pKa = 4.3EE126 pKa = 3.62ILSYY130 pKa = 9.38GTYY133 pKa = 10.35LIHH136 pKa = 6.9EE137 pKa = 5.14FSTAGTYY144 pKa = 9.26EE145 pKa = 3.98VILRR149 pKa = 11.84VEE151 pKa = 4.66DD152 pKa = 3.22DD153 pKa = 3.12WGAVSEE159 pKa = 4.73DD160 pKa = 3.57KK161 pKa = 10.81VTVTIEE167 pKa = 4.0AEE169 pKa = 4.09SGNDD173 pKa = 3.25AFIHH177 pKa = 5.5VSSIEE182 pKa = 3.94MQVSYY187 pKa = 10.97LGRR190 pKa = 11.84NSLGLATVKK199 pKa = 10.59VVDD202 pKa = 3.76QYY204 pKa = 12.25GNPIEE209 pKa = 4.16NAAIKK214 pKa = 9.6GVWSGVVTASQSGITAGDD232 pKa = 3.68GTVMFTSPKK241 pKa = 8.93TKK243 pKa = 9.89TSGEE247 pKa = 4.24FVFSVDD253 pKa = 3.07GVTASGYY260 pKa = 10.63VYY262 pKa = 10.95SPDD265 pKa = 4.62DD266 pKa = 3.68NVLEE270 pKa = 4.6LNSINNN276 pKa = 3.64
Molecular weight: 29.2 kDa
Isoelectric point according different methods:
Protein with the highest isoelectric point:
>tr|I5B510|I5B510_9DELT dTDP-4-dehydrorhamnose 3 5-epimerase OS=Desulfobacter postgatei 2ac9 OX=879212 GN=DespoDRAFT_02738 PE=3 SV=1
MM1 pKa = 7.59IFLGSVIKK9 pKa = 10.43KK10 pKa = 9.31RR11 pKa = 11.84RR12 pKa = 11.84KK13 pKa = 9.28KK14 pKa = 9.1MRR16 pKa = 11.84KK17 pKa = 7.92HH18 pKa = 4.98KK19 pKa = 10.0HH20 pKa = 5.3RR21 pKa = 11.84KK22 pKa = 8.54LLAKK26 pKa = 9.59TRR28 pKa = 11.84HH29 pKa = 4.37QRR31 pKa = 11.84KK32 pKa = 9.36KK33 pKa = 10.32KK34 pKa = 10.13
MM1 pKa = 7.59IFLGSVIKK9 pKa = 10.43KK10 pKa = 9.31RR11 pKa = 11.84RR12 pKa = 11.84KK13 pKa = 9.28KK14 pKa = 9.1MRR16 pKa = 11.84KK17 pKa = 7.92HH18 pKa = 4.98KK19 pKa = 10.0HH20 pKa = 5.3RR21 pKa = 11.84KK22 pKa = 8.54LLAKK26 pKa = 9.59TRR28 pKa = 11.84HH29 pKa = 4.37QRR31 pKa = 11.84KK32 pKa = 9.36KK33 pKa = 10.32KK34 pKa = 10.13
Molecular weight: 4.3 kDa
Isoelectric point according different methods:
Peptides (in silico digests for buttom-up proteomics)
Below you can find in silico digests of the whole proteome with Trypsin, Chymotrypsin, Trypsin+LysC, LysN, ArgC proteases suitable for different mass spec machines.| Try ESI |
 |
|---|
| ChTry ESI |
 |
|---|
| ArgC ESI |
 |
|---|
| LysN ESI |
 |
|---|
| TryLysC ESI |
 |
|---|
| Try MALDI |
 |
|---|
| ChTry MALDI |
 |
|---|
| ArgC MALDI |
 |
|---|
| LysN MALDI |
 |
|---|
| TryLysC MALDI |
 |
|---|
| Try LTQ |
 |
|---|
| ChTry LTQ |
 |
|---|
| ArgC LTQ |
 |
|---|
| LysN LTQ |
 |
|---|
| TryLysC LTQ |
 |
|---|
| Try MSlow |
 |
|---|
| ChTry MSlow |
 |
|---|
| ArgC MSlow |
 |
|---|
| LysN MSlow |
 |
|---|
| TryLysC MSlow |
 |
|---|
| Try MShigh |
 |
|---|
| ChTry MShigh |
 |
|---|
| ArgC MShigh |
 |
|---|
| LysN MShigh |
 |
|---|
| TryLysC MShigh |
 |
|---|
General Statistics
Number of major isoforms |
Number of additional isoforms |
Number of all proteins |
Number of amino acids |
Min. Seq. Length |
Max. Seq. Length |
Avg. Seq. Length |
Avg. Mol. Weight |
|---|---|---|---|---|---|---|---|
0 |
1120179 |
29 |
3812 |
329.9 |
36.79 |
Amino acid frequency
Ala |
Cys |
Asp |
Glu |
Phe |
Gly |
His |
Ile |
Lys |
Leu |
|---|---|---|---|---|---|---|---|---|---|
8.051 ± 0.04 | 1.312 ± 0.016 |
5.787 ± 0.032 | 6.168 ± 0.037 |
4.558 ± 0.027 | 7.066 ± 0.037 |
2.093 ± 0.018 | 7.303 ± 0.039 |
6.467 ± 0.04 | 9.635 ± 0.039 |
Met |
Asn |
Gln |
Pro |
Arg |
Ser |
Thr |
Val |
Trp |
Tyr |
|---|---|---|---|---|---|---|---|---|---|
2.772 ± 0.02 | 4.062 ± 0.026 |
4.292 ± 0.026 | 3.637 ± 0.027 |
5.053 ± 0.033 | 5.926 ± 0.031 |
5.398 ± 0.028 | 6.45 ± 0.032 |
1.021 ± 0.015 | 2.948 ± 0.023 |
Most of the basic statistics you can see at this page can be downloaded from this CSV file
Proteome-pI is available under Creative Commons Attribution-NoDerivs license, for more details see here
| Reference: Kozlowski LP. Proteome-pI 2.0: Proteome Isoelectric Point Database Update. Nucleic Acids Res. 2021, doi: 10.1093/nar/gkab944 | Contact: Lukasz P. Kozlowski |
