Mycetocola reblochoni REB411
Taxonomy: cellular organisms; Bacteria; Terrabacteria group; Actinobacteria; Actinomycetia; Micrococcales; Microbacteriaceae; Mycetocola; Mycetocola reblochoni
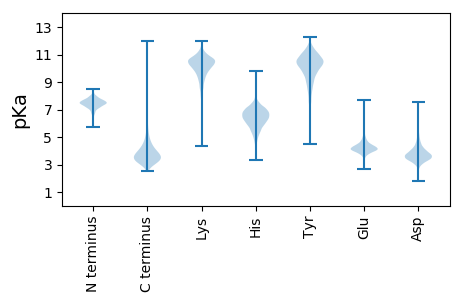
Average proteome isoelectric point is 6.1
Get precalculated fractions of proteins

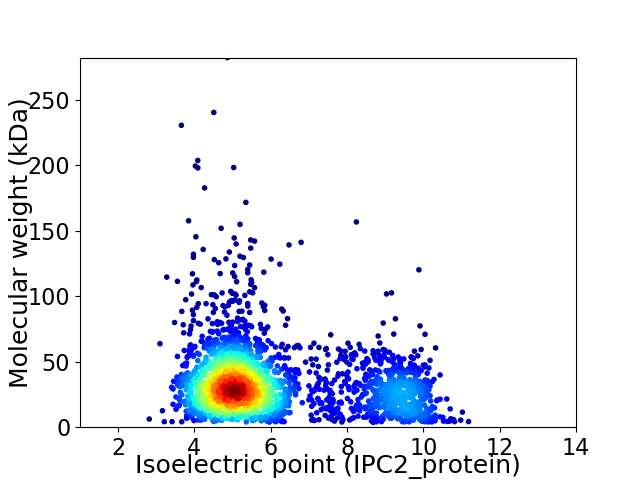
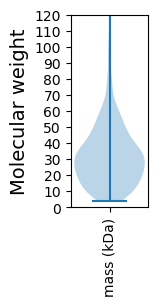
Virtual 2D-PAGE plot for 2621 proteins (isoelectric point calculated using IPC2_protein)
Get csv file with sequences according to given criteria:
* You can choose from 21 different methods for calculating isoelectric point
Summary statistics related to proteome-wise predictions


Protein with the lowest isoelectric point:
>tr|A0A1R4I924|A0A1R4I924_9MICO Translation initiation factor IF-1 OS=Mycetocola reblochoni REB411 OX=1255698 GN=infA PE=3 SV=1
MM1 pKa = 7.33ARR3 pKa = 11.84IPEE6 pKa = 4.28PEE8 pKa = 4.0QTPEE12 pKa = 3.93GPAYY16 pKa = 9.98EE17 pKa = 4.59GRR19 pKa = 11.84LLDD22 pKa = 3.95RR23 pKa = 11.84ADD25 pKa = 4.13EE26 pKa = 4.22EE27 pKa = 5.19VVDD30 pKa = 4.29QGAPFDD36 pKa = 4.01IGTLMSRR43 pKa = 11.84RR44 pKa = 11.84GVLGLIGVGVGTAALAACSSTASTGGATSTATASATATATPSASPSATATAVLPDD99 pKa = 3.92GEE101 pKa = 5.03IPDD104 pKa = 4.17EE105 pKa = 4.32TAGPYY110 pKa = 10.2PGDD113 pKa = 3.77GSNGPDD119 pKa = 3.17VLEE122 pKa = 3.67QSGIVRR128 pKa = 11.84QDD130 pKa = 2.64IRR132 pKa = 11.84SSIGGGATADD142 pKa = 3.73GVPLTFTLTLTDD154 pKa = 4.03MASGDD159 pKa = 3.74APFEE163 pKa = 4.23GVAVYY168 pKa = 9.79AWHH171 pKa = 7.55CDD173 pKa = 3.19AQGRR177 pKa = 11.84YY178 pKa = 8.89SMYY181 pKa = 10.36SDD183 pKa = 5.31GITEE187 pKa = 3.9EE188 pKa = 4.3SYY190 pKa = 11.41LRR192 pKa = 11.84GVQVADD198 pKa = 3.6ADD200 pKa = 4.3GEE202 pKa = 4.79VTFTSVFPGCYY213 pKa = 7.56TGRR216 pKa = 11.84WTHH219 pKa = 5.38IHH221 pKa = 6.17FEE223 pKa = 4.24VYY225 pKa = 10.25PDD227 pKa = 3.59VEE229 pKa = 5.07SITDD233 pKa = 3.51ASNAIATSQMALPEE247 pKa = 4.38DD248 pKa = 3.97ACTAVYY254 pKa = 10.35ARR256 pKa = 11.84SEE258 pKa = 4.27YY259 pKa = 10.79SGSSQNLAQITLDD272 pKa = 3.42SDD274 pKa = 4.0NVFGDD279 pKa = 4.32DD280 pKa = 4.91GGALQLATVSGDD292 pKa = 3.25ADD294 pKa = 3.71SGYY297 pKa = 10.85LAALTVRR304 pKa = 11.84VDD306 pKa = 3.43TTTEE310 pKa = 3.94PTAGAAPDD318 pKa = 3.69GGGAGGPGGQPPSNN332 pKa = 3.52
MM1 pKa = 7.33ARR3 pKa = 11.84IPEE6 pKa = 4.28PEE8 pKa = 4.0QTPEE12 pKa = 3.93GPAYY16 pKa = 9.98EE17 pKa = 4.59GRR19 pKa = 11.84LLDD22 pKa = 3.95RR23 pKa = 11.84ADD25 pKa = 4.13EE26 pKa = 4.22EE27 pKa = 5.19VVDD30 pKa = 4.29QGAPFDD36 pKa = 4.01IGTLMSRR43 pKa = 11.84RR44 pKa = 11.84GVLGLIGVGVGTAALAACSSTASTGGATSTATASATATATPSASPSATATAVLPDD99 pKa = 3.92GEE101 pKa = 5.03IPDD104 pKa = 4.17EE105 pKa = 4.32TAGPYY110 pKa = 10.2PGDD113 pKa = 3.77GSNGPDD119 pKa = 3.17VLEE122 pKa = 3.67QSGIVRR128 pKa = 11.84QDD130 pKa = 2.64IRR132 pKa = 11.84SSIGGGATADD142 pKa = 3.73GVPLTFTLTLTDD154 pKa = 4.03MASGDD159 pKa = 3.74APFEE163 pKa = 4.23GVAVYY168 pKa = 9.79AWHH171 pKa = 7.55CDD173 pKa = 3.19AQGRR177 pKa = 11.84YY178 pKa = 8.89SMYY181 pKa = 10.36SDD183 pKa = 5.31GITEE187 pKa = 3.9EE188 pKa = 4.3SYY190 pKa = 11.41LRR192 pKa = 11.84GVQVADD198 pKa = 3.6ADD200 pKa = 4.3GEE202 pKa = 4.79VTFTSVFPGCYY213 pKa = 7.56TGRR216 pKa = 11.84WTHH219 pKa = 5.38IHH221 pKa = 6.17FEE223 pKa = 4.24VYY225 pKa = 10.25PDD227 pKa = 3.59VEE229 pKa = 5.07SITDD233 pKa = 3.51ASNAIATSQMALPEE247 pKa = 4.38DD248 pKa = 3.97ACTAVYY254 pKa = 10.35ARR256 pKa = 11.84SEE258 pKa = 4.27YY259 pKa = 10.79SGSSQNLAQITLDD272 pKa = 3.42SDD274 pKa = 4.0NVFGDD279 pKa = 4.32DD280 pKa = 4.91GGALQLATVSGDD292 pKa = 3.25ADD294 pKa = 3.71SGYY297 pKa = 10.85LAALTVRR304 pKa = 11.84VDD306 pKa = 3.43TTTEE310 pKa = 3.94PTAGAAPDD318 pKa = 3.69GGGAGGPGGQPPSNN332 pKa = 3.52
Molecular weight: 33.49 kDa
Isoelectric point according different methods:
Protein with the highest isoelectric point:
>tr|A0A1R4III0|A0A1R4III0_9MICO L-proline glycine betaine ABC transport system permease protein ProW (TC 3.A.1.12.1) OS=Mycetocola reblochoni REB411 OX=1255698 GN=FM119_01990 PE=3 SV=1
MM1 pKa = 7.21TRR3 pKa = 11.84TAATRR8 pKa = 11.84RR9 pKa = 11.84SGTTPRR15 pKa = 11.84RR16 pKa = 11.84LVLRR20 pKa = 11.84RR21 pKa = 11.84LAPPRR26 pKa = 11.84LTPPRR31 pKa = 11.84LVPSRR36 pKa = 11.84PSS38 pKa = 2.88
MM1 pKa = 7.21TRR3 pKa = 11.84TAATRR8 pKa = 11.84RR9 pKa = 11.84SGTTPRR15 pKa = 11.84RR16 pKa = 11.84LVLRR20 pKa = 11.84RR21 pKa = 11.84LAPPRR26 pKa = 11.84LTPPRR31 pKa = 11.84LVPSRR36 pKa = 11.84PSS38 pKa = 2.88
Molecular weight: 4.29 kDa
Isoelectric point according different methods:
Peptides (in silico digests for buttom-up proteomics)
Below you can find in silico digests of the whole proteome with Trypsin, Chymotrypsin, Trypsin+LysC, LysN, ArgC proteases suitable for different mass spec machines.| Try ESI |
 |
|---|
| ChTry ESI |
 |
|---|
| ArgC ESI |
 |
|---|
| LysN ESI |
 |
|---|
| TryLysC ESI |
 |
|---|
| Try MALDI |
 |
|---|
| ChTry MALDI |
 |
|---|
| ArgC MALDI |
 |
|---|
| LysN MALDI |
 |
|---|
| TryLysC MALDI |
 |
|---|
| Try LTQ |
 |
|---|
| ChTry LTQ |
 |
|---|
| ArgC LTQ |
 |
|---|
| LysN LTQ |
 |
|---|
| TryLysC LTQ |
 |
|---|
| Try MSlow |
 |
|---|
| ChTry MSlow |
 |
|---|
| ArgC MSlow |
 |
|---|
| LysN MSlow |
 |
|---|
| TryLysC MSlow |
 |
|---|
| Try MShigh |
 |
|---|
| ChTry MShigh |
 |
|---|
| ArgC MShigh |
 |
|---|
| LysN MShigh |
 |
|---|
| TryLysC MShigh |
 |
|---|
General Statistics
Number of major isoforms |
Number of additional isoforms |
Number of all proteins |
Number of amino acids |
Min. Seq. Length |
Max. Seq. Length |
Avg. Seq. Length |
Avg. Mol. Weight |
|---|---|---|---|---|---|---|---|
0 |
853725 |
37 |
2761 |
325.7 |
34.58 |
Amino acid frequency
Ala |
Cys |
Asp |
Glu |
Phe |
Gly |
His |
Ile |
Lys |
Leu |
|---|---|---|---|---|---|---|---|---|---|
13.736 ± 0.074 | 0.448 ± 0.009 |
6.351 ± 0.044 | 5.73 ± 0.049 |
2.782 ± 0.028 | 9.4 ± 0.053 |
1.858 ± 0.024 | 4.282 ± 0.038 |
1.617 ± 0.038 | 10.104 ± 0.065 |
Met |
Asn |
Gln |
Pro |
Arg |
Ser |
Thr |
Val |
Trp |
Tyr |
|---|---|---|---|---|---|---|---|---|---|
1.599 ± 0.02 | 1.859 ± 0.029 |
5.366 ± 0.038 | 2.64 ± 0.025 |
7.583 ± 0.063 | 6.101 ± 0.041 |
6.24 ± 0.048 | 9.129 ± 0.051 |
1.35 ± 0.021 | 1.823 ± 0.023 |
Most of the basic statistics you can see at this page can be downloaded from this CSV file
Proteome-pI is available under Creative Commons Attribution-NoDerivs license, for more details see here
| Reference: Kozlowski LP. Proteome-pI 2.0: Proteome Isoelectric Point Database Update. Nucleic Acids Res. 2021, doi: 10.1093/nar/gkab944 | Contact: Lukasz P. Kozlowski |
